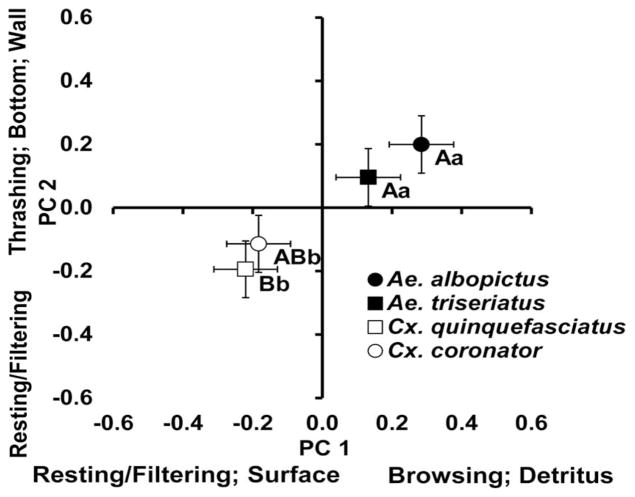
Fig. 2.
Bivariate means (±SE) for PC 1 and PC 2 that made the greatest contributions of the effect of species. Activities and positions most closely associated with large positive or negative factor scores are indicated parallel to each axis. Differences in means between species for PC 1 are represented by lowercase letters, while differences in means between species for PC 2 are represented by uppercase letters.

