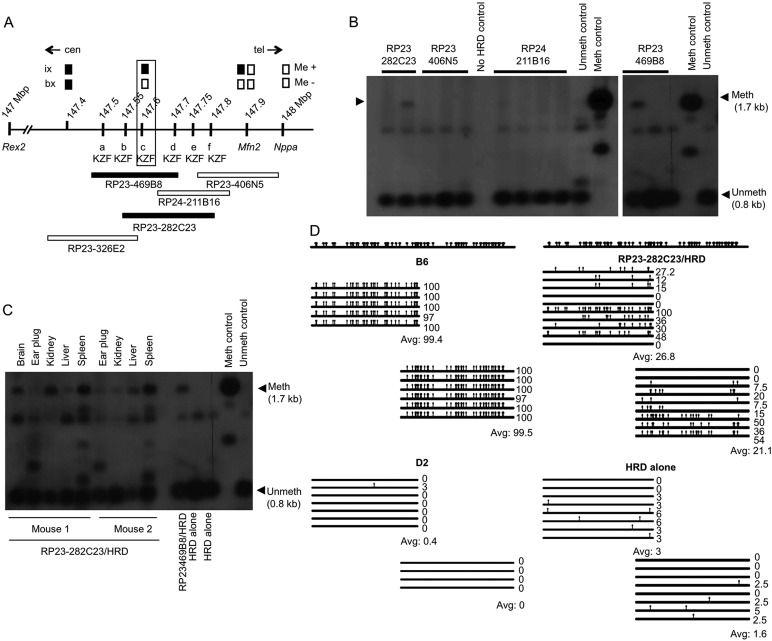
Fig. 1.
Mapping and identification of the Ssm1 gene. (A) Map of distal chromosome 4. Me+ and Me– indicate methylation present or absent of HRD in recombinants (ix, intercross; bx, backcross). Boxes indicate genotype: black, B6 genotype; white, D2 genotype. a, b, c, d, e, f are six candidate KZF genes. Position (Mb) on chromosome 4 is indicated (NCBI Annotation, Release 103); at 147.6 Mb Ssm1b is outlined. Beneath are five overlapping BACs. Centromeric/telomeric (cen/tel) orientation is indicated. (B) Southern blot showing HRD (see map in supplementary material Fig. S1) methylation in BAC RP23-282C23 or BAC RP23-469B8 transgenic mice. Meth, methylated; unmeth, unmethylated band. Different lanes for the same BAC represent littermates. (C) Southern blot showing HRD methylation in two mice carrying independent integrations of BAC RP23-282C23. (D) Bisulfite analysis: increased HRD/gpt methylation in tail DNA from mouse 1 of C. HRD alone, littermates without BAC. Each horizontal line represents the sequence from an individual bacterial colony. Vertical bars, meCpGs. The percentage of CpGs methylated is indicated. Above is shown all the CpGs in this sequence. First part of gpt analyzed, 530 nt; second part of gpt analyzed, 540 nt; overlap between the two parts of gpt, 162 nt.

