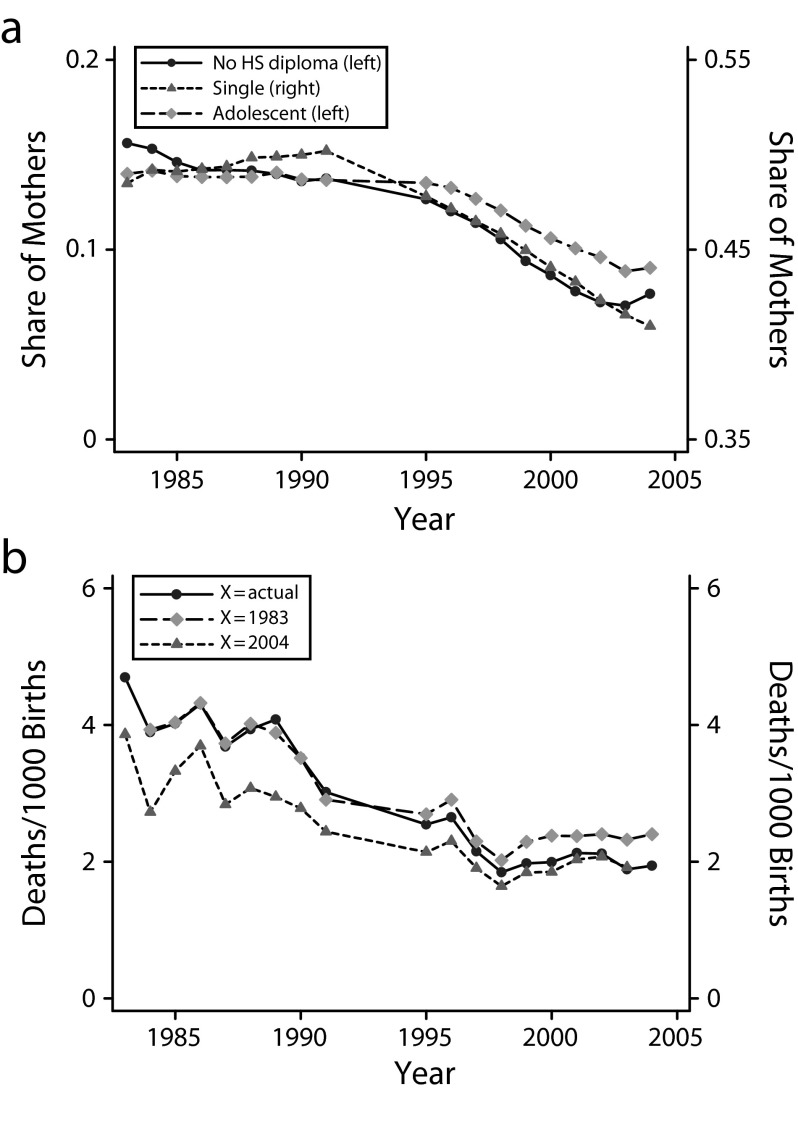
FIGURE 4—
Trends in (a) gaps in maternal risk factors and (b) explained IMR gaps: United States, 1983–2004.
Note. HS = high school; IMR = infant mortality rate. The analytic series was used to construct these graphs. In part a, the legend lists the y-axis used for each characteristic (e.g., left or right). In part b, the legend lists the risk factors used in computing each explained IMR gap (e.g., the risk factors from the actual year, 1983, or 2004).

