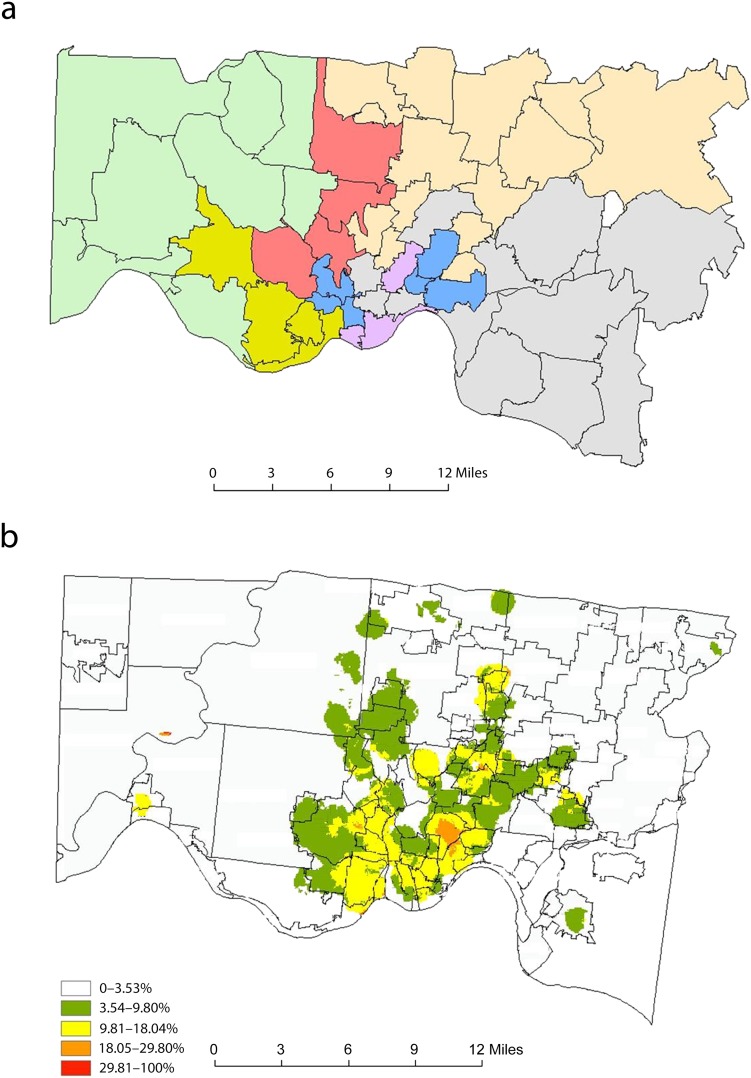
FIGURE 2—
Maps of (a) agency catchment areas and (b) nonenrollment: Hamilton County, OH, 2007–2009.
Note. Panel a depicts primary geographic catchment areas for each home visiting agency, defined by color blocks; delineated borders represent zip code boundaries. Panel b depicts heat gradient for nonenrollment among mothers referred to home visiting; delineated borders represent neighborhood boundaries. Smoothed intensity estimation demonstrates geographic areas of lower and higher concentrations of nonenrollment. Geographic cells in the periphery are masked to suppress variation attributable to small sample sizes.

