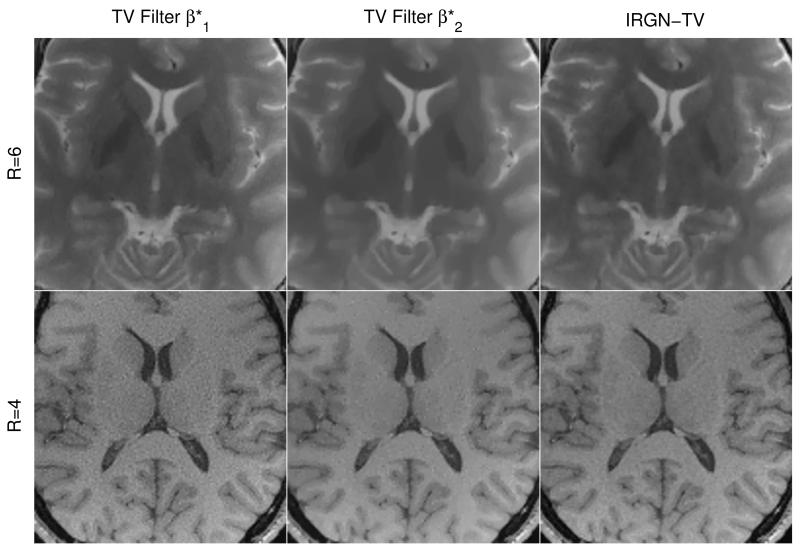
Figure 4.
Comparison of IRGN-TV to TV filtering of conventional IRGN reconstructions for pseudorandom subsampling with R = 6 (top, same data as Fig. 2) and accelerated in-vivo imaging with R = 4 (bottom). For TV filtering, optimal regularization parameters were identified by visual inspection: (left, for T2 weighted TSE data) and (middle, for FLASH data). Both results for IRGN-TV (right) were obtained using the same parameter set, esp. βmin = 0.

