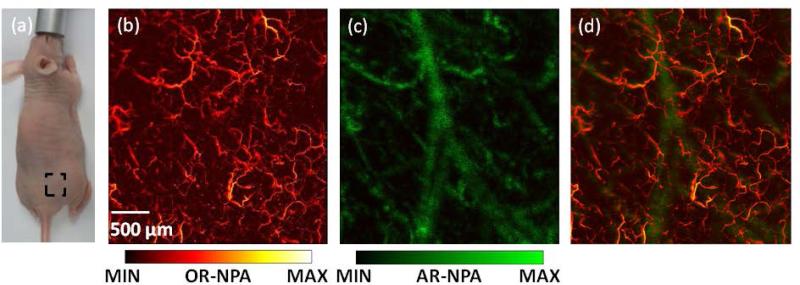
Fig. 4.
(Color online) Combined PAM images of mouse back. (a) Photograph of the mouse. The region of interest is highlighted in the dashed box. (b) OR-PAM image of skin. (c) AR-PAM image. (d) Overlaid PAM image (see Media 1). OR-NPA: normalized photoacoustic amplitude in OR image; AR-NPA: normalized photoacoustic amplitude in AR image

