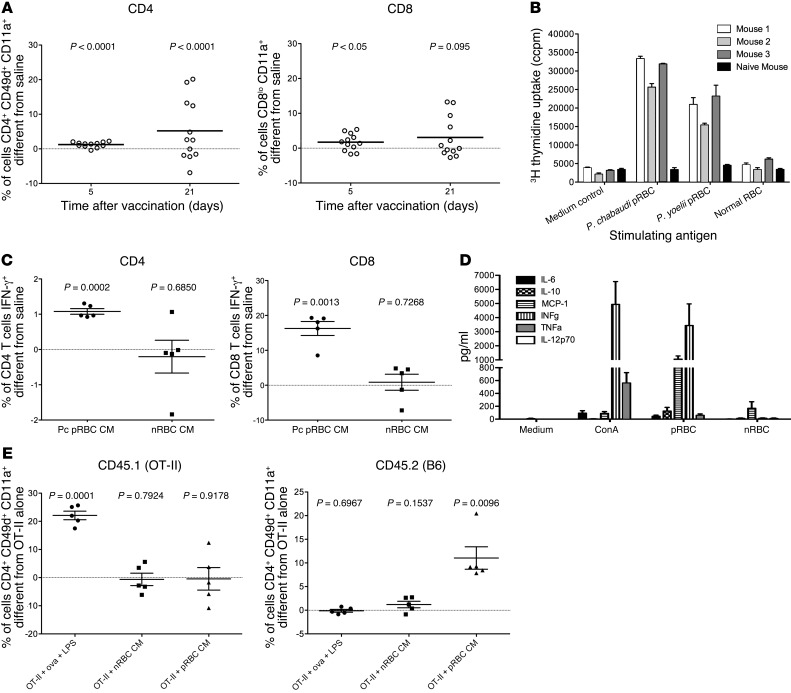
Figure 3. Immune responses induced by chemically attenuated parasites.
(A) C57BL/6 mice (12 per group) were vaccinated with 106P. chabaudi prbcs attenuated with centanamycin or injected with saline. Phenotypes of blood CD4+ and CD8+ cells were assessed on days 5 and 21 after vaccination. Values for means of the saline group were subtracted from values for each vaccinated mouse. Each circle represents 1 mouse. Horizontal bars represent means. One sample t test was performed comparing values to the saline mean of zero. (B) Three A/J mice were immunized with 3 doses of vaccine (each, 106 centanamycin-attenuated P. chabaudi prbcs), and spleen cells from these and a naive mouse were collected 8 weeks after the last immunization and cultured with indicated antigens; uptake of 3H thymidine was determined after 72 hours as described in Methods. (C) C57BL/6 mice (5 per group) were vaccinated with 106P. chabaudi prbcs or equivalent nrbcs attenuated with centanamycin and sacrificed on day 5. Spleen cells were stimulated in vitro for 4 hours with PMA and ionomycin in the presence of BFA and stained for IFN-γ. Percentage that was IFN-γ positive was determined by subtracting isotype control and values from mice injected with saline for CD4 and CD8 populations. (D) Three A/J mice were immunized with 3 doses of vaccine (each, 106 centanamycin-attenuated P. chabaudi prbcs), and spleen cells from these mice were collected 50 days after the last immunization, cultured with indicated antigens, and after 72 hours culture, supernatants collected and use for cytokine bead analysis as described in Methods. (E) C57BL/6 mice (CD45.2, 5 per group) were adoptively transferred with OT-II T cells (CD45.1), and 1 group received ovalbumin peptide 323–339 mixed with LPS i.p. 24 hours later, mice were immunized i.v. with 106P. chabaudi prbcs or equivalent nrbcs attenuated with centanamycin. Mice were bled on day 6 after immunization and the phenotype of donor and recipient cells determined by flow cytometry. Percentages were calculated by subtracting values from mice receiving OT-II cells alone.

