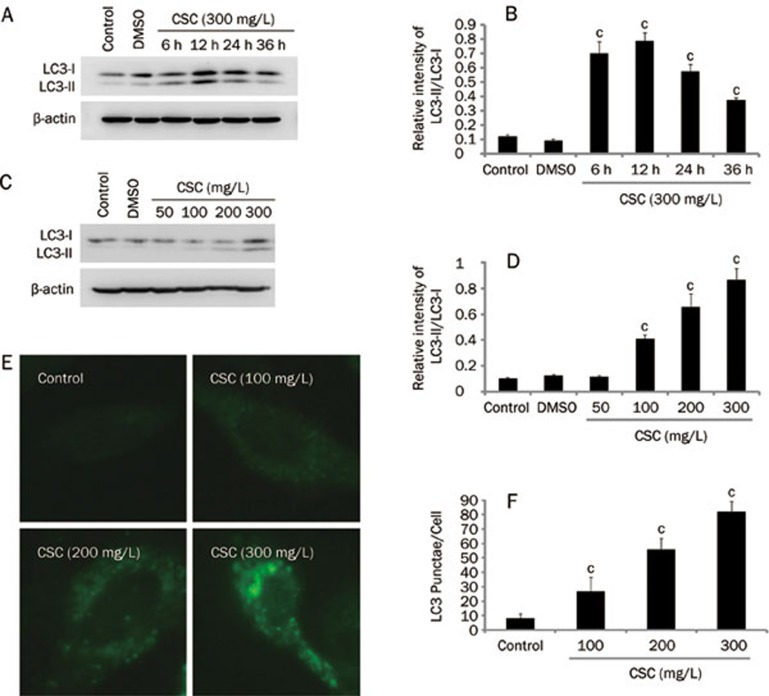
Figure 2.
CSC-induced autophagy of Beas-2B cells is dose-and time-dependent. (A) Beas-2B cells were treated with CSC (300 mg/L), and cellular proteins were collected at the indicated time points and analyzed by Western blot. (C) Beas-2B cells were treated with CSC, at the indicated concentrations, for 12 h. Western blot was performed using anti-LC3 antibody. (B and D) The relative intensity of LC3-II/LC3-I was calculated by densitometry. (E) Beas-2B cells were treated with CSC, at the indicated concentrations, for 12 h. LC3 was detected by an immunofluorescence assay and examined using fluorescence microscopy, and representative cells were selected and photographed (×400). (F) Number of LC3 punctae per cell, for a total of 25 cells in 5 fields of view. Mean±SD. n=3. cP<0.01 vs control.

