Figure 5.
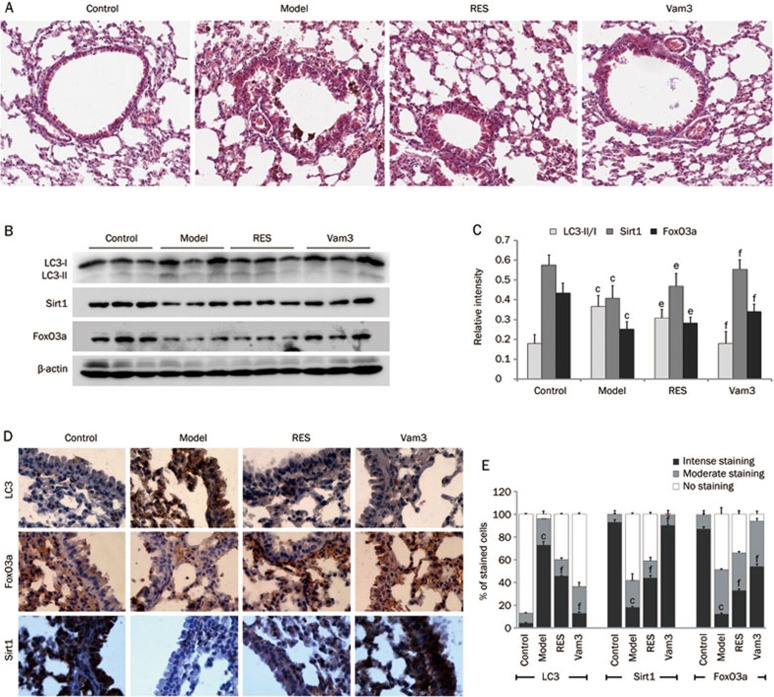
Vam3 attenuates CS-induced autophagy in the lungs of mice. Lung samples from each group (Control group: air-exposed mice; Model group: CS-exposed mice; RES group: CS-exposed mice with 30 mg/kg RES treatment; Vam3 group: CS-exposed mice with 50 mg/kg Vam3 treatment) were used for immunoblotting, HE staining and immunohistochemical analyses. (A) The lung sections were stained with hematoxylin and eosin, and the representative areas were captured by microscopy. (B) Expressions of LC3, FoxO3a, and Sirt1 in lung tissues from each group were determined by Western blotting. (C) The amounts of LC3, Sirt1 and FoxO3a were calculated by densitometry and normalized to corresponding actin levels (n=8 per group). (D) Expressions of LC3, FoxO3a, and Sirt1 in lung alveolar/airway epithelial cells from each group were determined using immunohistochemical staining (×400). (E) The number of stained cells from different levels (Intense staining level, Moderate staining level, No staining level) were calculated by ImageJ and normalized to corresponding total cells (n=4 per group). cP<0.01, compared to control; eP<0.05, fP<0.01, compared to the Model group.

