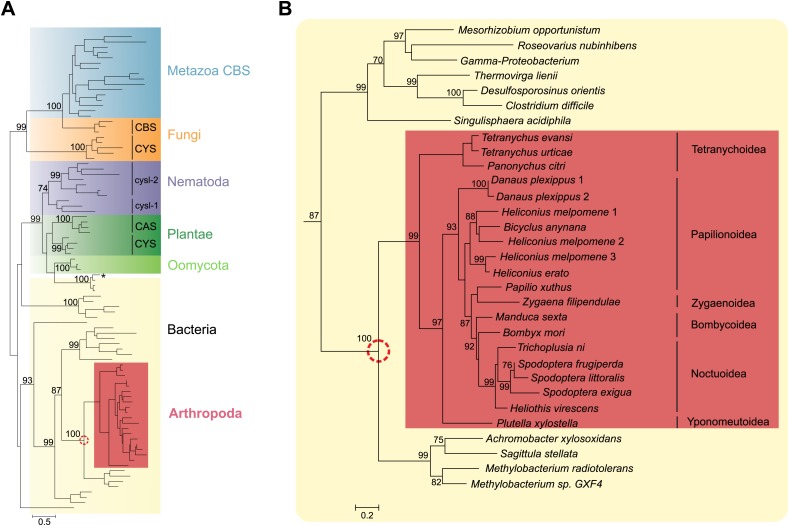
Figure 2. Panel A: Phylogenetic analysis of β-substituted alanine synthases, showing arthropod sequences nested within bacterial cysteine synthases.
The fungal CYS, metazoan and fungal CBS as well as the plant, oomycete and nematode CYS and CAS sequences are marked with a different color. The two branches of nematode sequences, marked as cysl-1 and cysl-2, include the sequences coded by the two genes previously characterized in C. elegans (Budde and Roth, 2011). The CYS and CAS groups within Plantae represent plant protein sequences with CYS and CAS activity, respectively (Yamaguchi et al., 2000). The asterisk represents a CYS sequence of the mealybug P. citri acquired by horizontal gene transfer from its endosymbiont (Husnik et al., 2013). Panel B: Detailed view of the bacterial CYS sequences showing the embedded sequences of tetranychid mites and Lepidoptera. In both panels support values of only important nodes are shown. The scale bar represents 0.5 and 0.2 substitutions per site in panel A and panel B, respectively.


