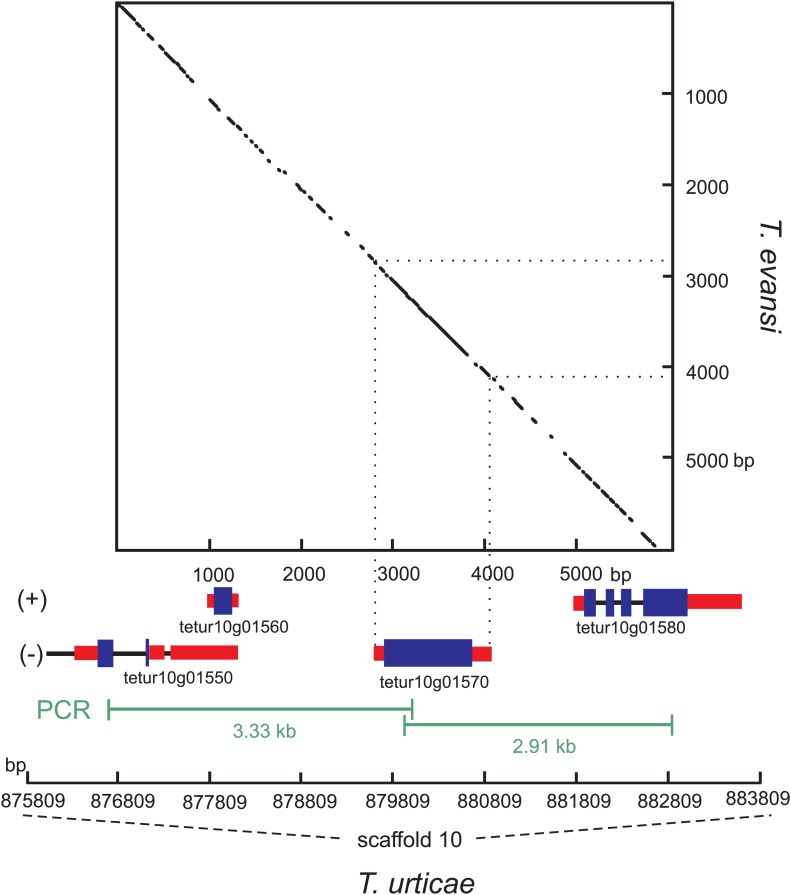
Figure 4. Nucleotide dot plot of the PCR amplified genomic region bracketing T. urticae and T. evansi CAS with adjacent intron-containing eukaryotic genes.
The dot-plot was constructed with 95% identity in a 21 bp window, with the T. evansi and the T. urticae amplified region on the y- and x-axis, respectively. From the T. urticae region, the gene models and their genomic positions on the 10th scaffold are specified below the x-axis. The (+) and (−) signs represent the forward and reverse strand, respectively. Blue and black bars indicate exons and introns respectively, while the untranslated regions are depicted as red bars.


