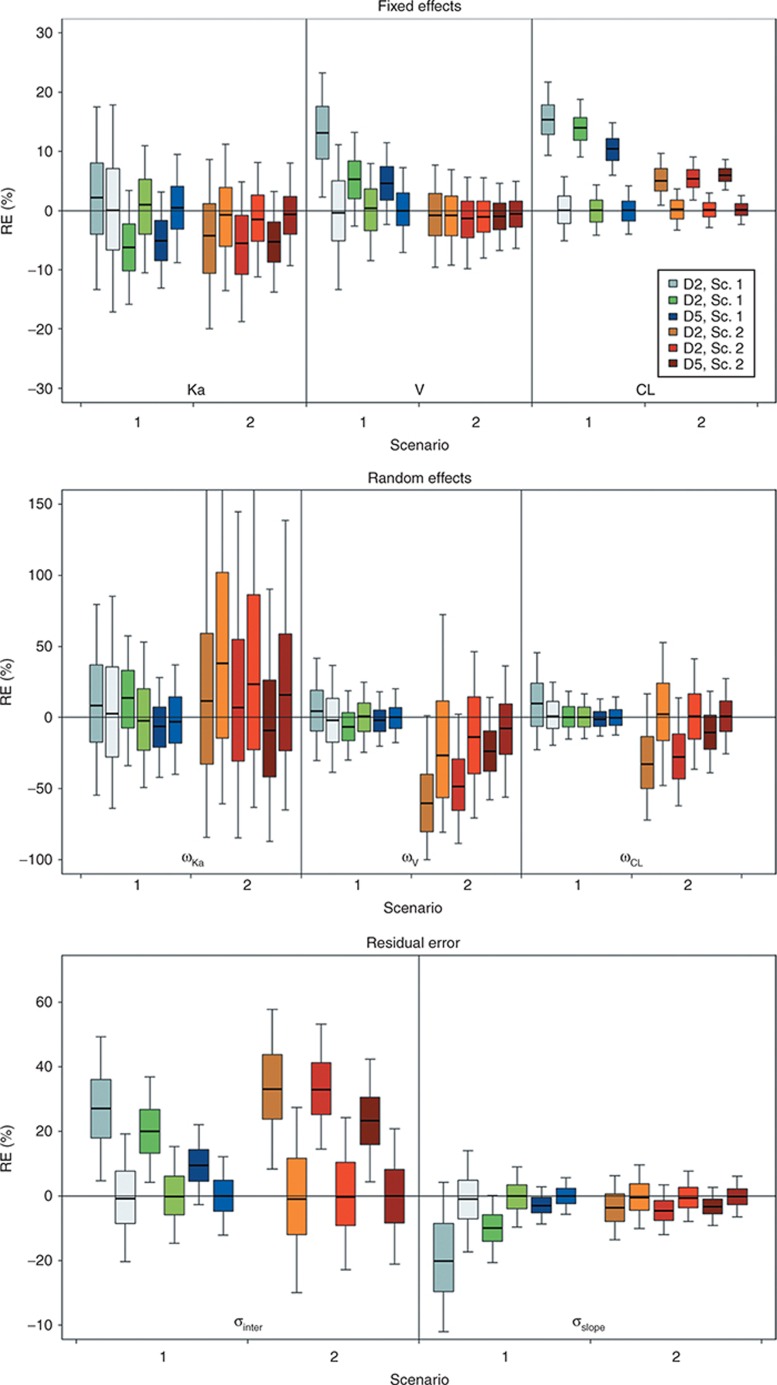
Figure 2.
Boxplot of relative error (RE; %) on estimated fixed effects (top) without covariate effect, random effects (middle), and residual error parameters (bottom) according to scenario 1 or 2, the design, and the estimation algorithms. Boxplots represent the median, quartiles, and 5–95% percentiles. Colors stand for the design and the scenario. For the same color, the dark areas represent the first-order conditional estimation with interaction algorithm and the pale areas denote the stochastic approximation expectation maximization algorithm. Sc., scenario.

