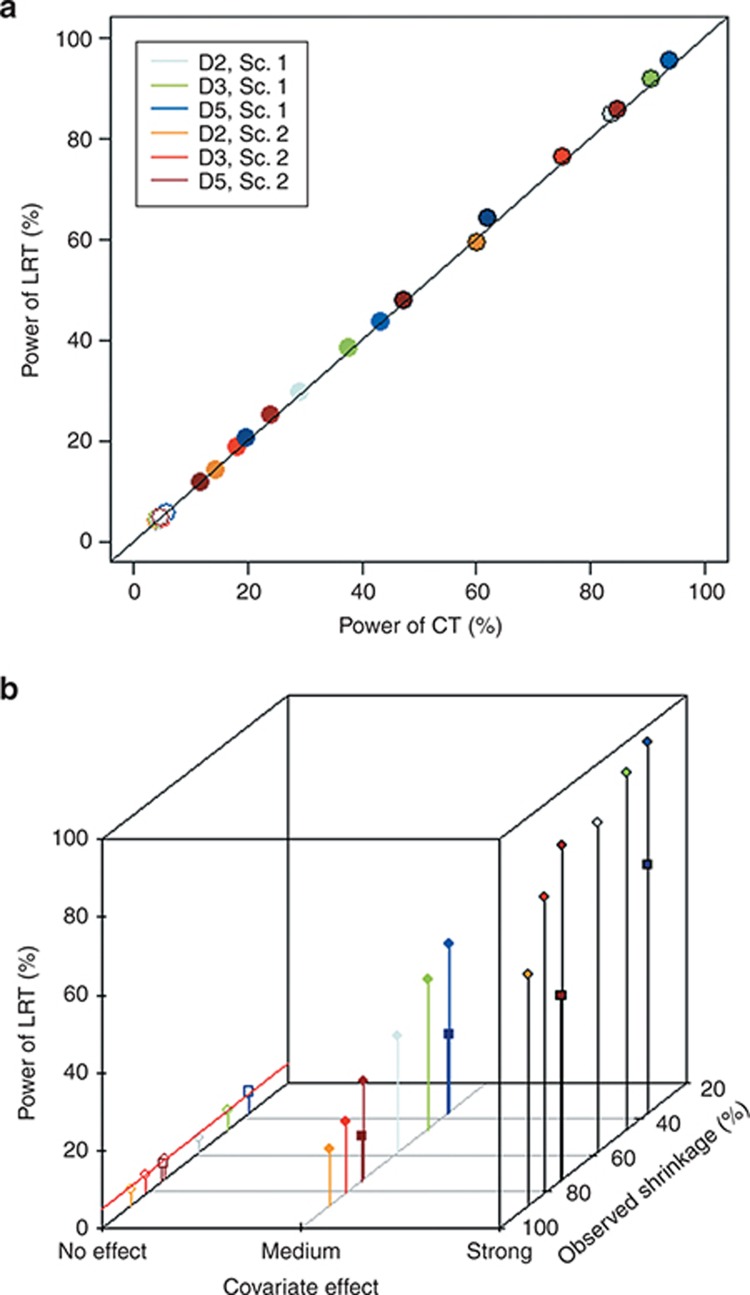
Figure 5.
Power of likelihood ratio test (LRT) between weight (WT) and volume (V) (%), for all scenarios and designs (estimation with stochastic approximation expectation maximization algorithm) vs. (a) correlation test (CT; %; the black line represents the identity line). (b) Observed shrinkage on V (%) and covariate effect. Colors stand for the design and the scenario. Covariate effect is expressed by the background and colors: no effect with a colored line around dots, medium effect with fully colored dots, and strong covariate effect with black line around a colored dot. For D5, pale and dark areas are used respectively for designs with 500 and 200 subjects. Sc., scenario.

