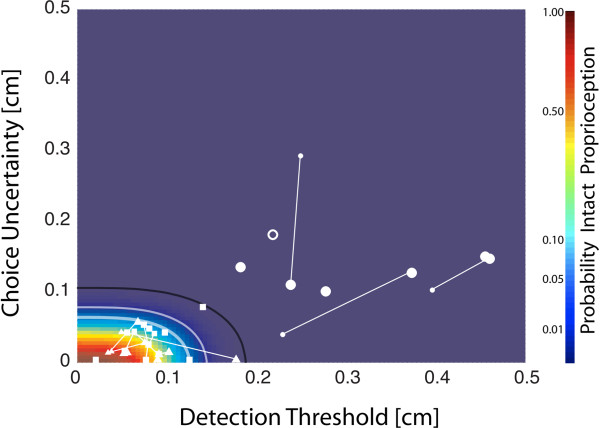
Figure 4.
Plot of DT versus CU for all participants in the primary experimental study (□: NIC; ∆: SS + P; o: SS-P). For subjects who participated in two days of testing, Day1 results (larger symbols) are connected to Day 2 results (smaller symbols) by a thin line. These data are superimposed on top of a probability map defined as the product of the DT and CU cumulative distribution functions. The curved lines correspond to the 95% (thick white), 99% (thin white) and 99.9% (thin black) confidence bounds on the cumulative, bivariate {DT, CU} distribution of NIC data points.

