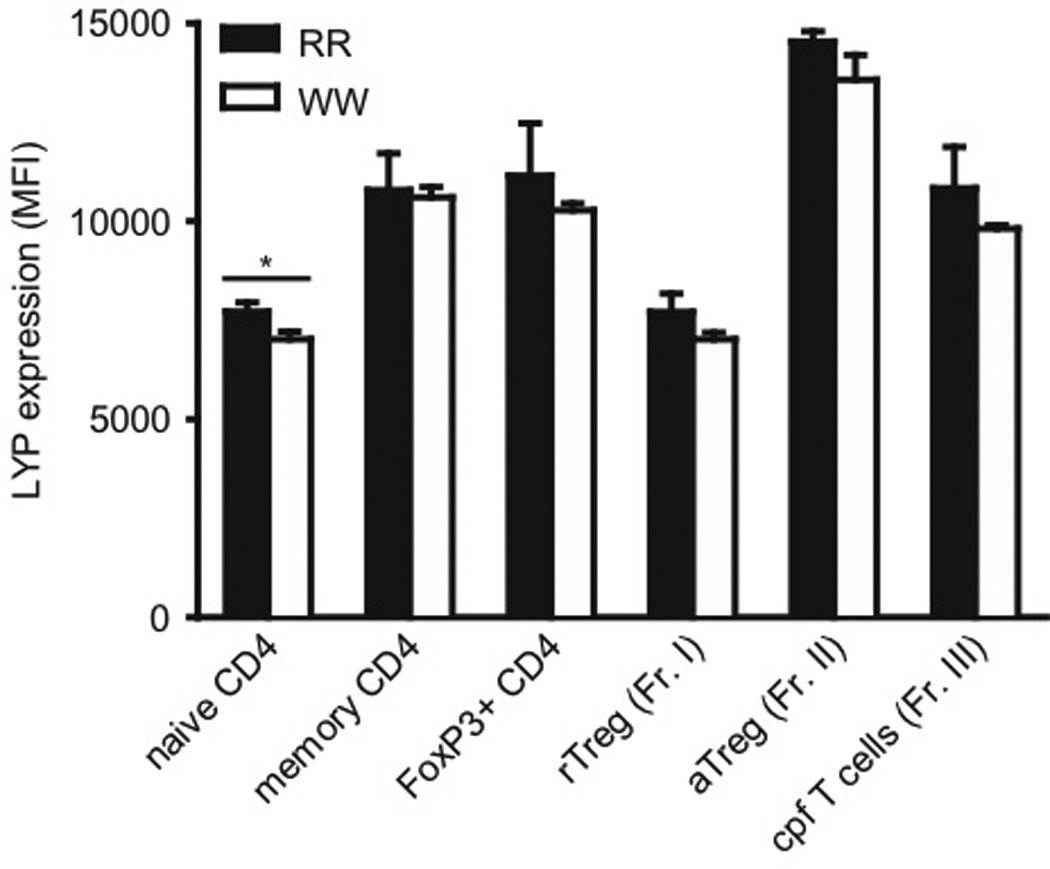
FIGURE 7.

Expression of LYP*R620 and LYP*W620 in various CD4+ T cell subsets from RR and WW individuals. Purified CD4+ T cells from genotyped donors (three individuals in each group) were stained with fluorescently labeled antibodies and analyzed by FACS to evaluate LYP expression in various subsets. Bars represent average ± SD (RR; black, WW; white); *P < 0.05, determined by t-test.
