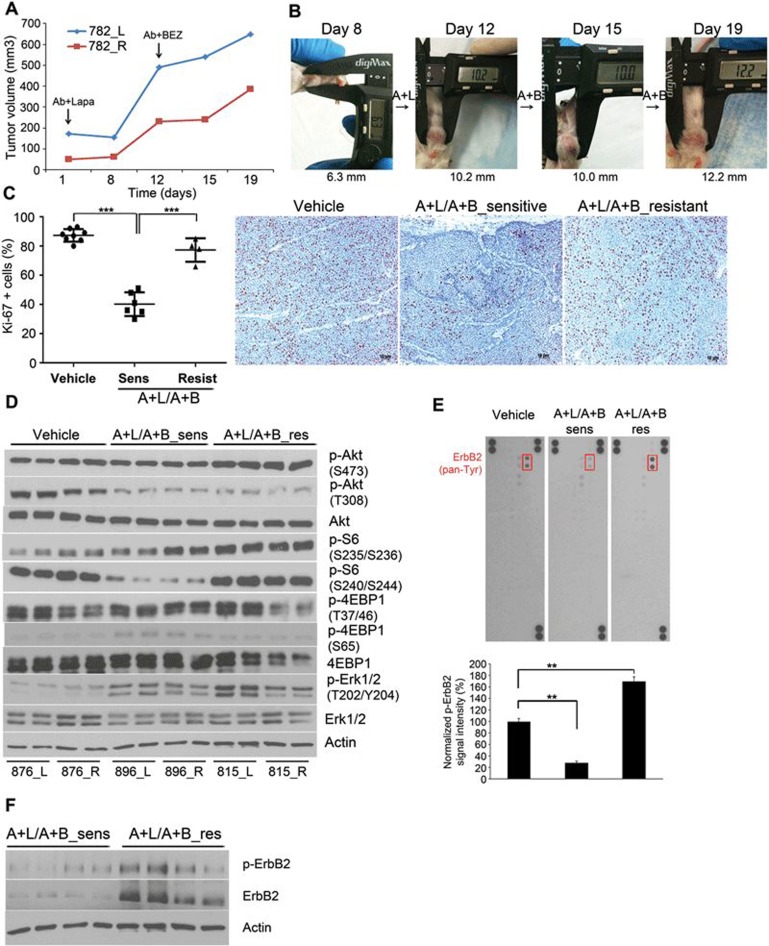
Figure 4.
Resistance to Ab7.16.4 + BEZ235 develops through activation of p-ErbB2 and downstream signaling. (A) Tumor volume measurements at different time points for transplant mice (782_L and 782_R) treated with Ab + lapatinib first and then with Ab + BEZ235 on day 12. Resistance to Ab + BEZ developed on day 19. (B) Representative pictures of tumors from mouse 782_L taken at shown time points after treatments indicated in A. (C) Ki-67 staining of the sensitive and resistant tumors treated with A + L/A + B sequential therapy. ***P < 0.001, by two-tailed t-test. (D) Western blot analysis of A + L/A + B-sensitive and -resistant tumors shown in C. (E) Top, phospho-RTK array comparing the phosphorylation of 39 RTKs in tumors from D. Bottom, quantification of p-ErbB2 signal intensity using Image J software. **P < 0.01, by two-tailed t-test. (F) Western blot analysis of A + L/A + B-sensitive and -resistant tumors shown in C. Actin was used as a loading control.

