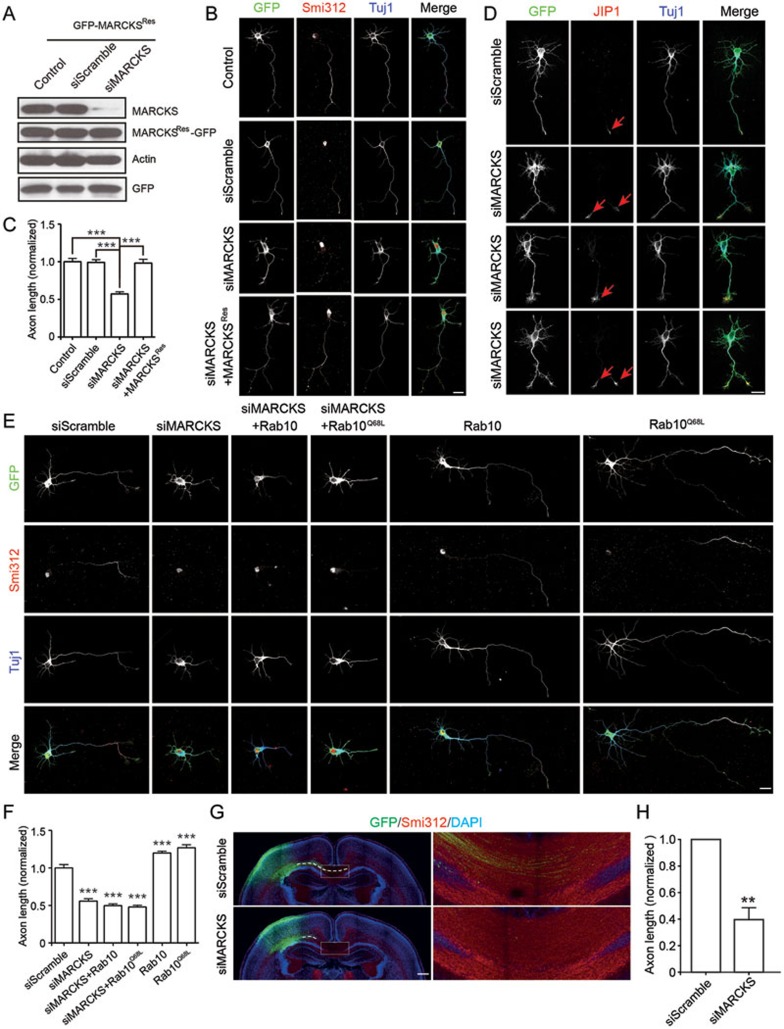
Figure 2.
MARCKS is important for axon development. (A) Cortical neurons were transfected with pSUPER vector or pSUPER encoding siRNAs against MARCKS (siMARCKS) or scrambled sequence (siScramble) together with MARCKSRes. Endogenous MARCKS and MARCKSRes levels were analyzed by IB with antibody against MARCKS or GFP, respectively. Actin and vector-encoded GFP were probed as controls. (B) Isolated cortical neurons were transfected with EGFP, siScramble, or siMARCKS, either alone or together with MARCKSRes. At DIV3, cultures were fixed and analyzed for axon length. Scale bar, 20 μm. (C) Quantification of normalized axon length. Data are shown as mean ± SEM. At least 80 neurons from three independent experiments were analyzed. ***P < 0.001, one-way ANOVA. (D) DIV3 cortical neurons transfected with siScramble or siMARCKS were stained with anti-JIP1 and Tuj1 antibodies. Note the specific localization of JIP1 in axonal tips (red arrows). Scale bar, 20 μm. (E) Isolated cortical neurons were transfected with various plasmid combinations, and then stained with Smi312 and Tuj1 at DIV3. Scale bar, 20 μm. (F) Quantification of normalized axon length. Data are shown as mean ± SEM. At least 80 neurons from three independent experiments were analyzed. ***P < 0.001, one-way ANOVA. (G, H) P2 neocortical slices from rat embryos electroporated at E16.5 with plasmids encoding siScramble or siMARCKS, together with pCAG-EYFP, were analyzed for axon development. Smi312 was used to label axonal tracts. Enlarged areas indicate axon tracts coursing through the intermediate zone (IZ). The length of these axon bundles, as sketched by dashed lines which delineate the path of axonal tracts in the IZ, was quantified with the value from control group normalized as 1.0 (H). Data are presented as mean ± SEM. At least four animals in each group were analyzed. **P < 0.01, Student's t-test. Scale bar, 500 μm.

