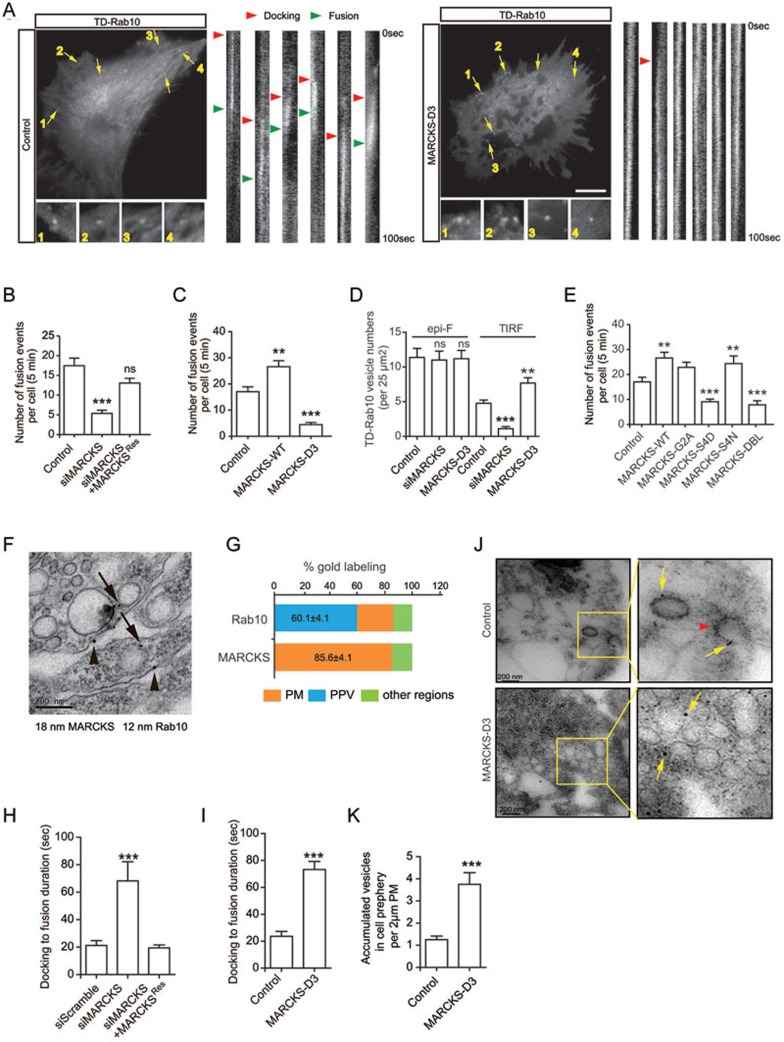
Figure 4.
MARCKS interaction with Rab10 is important for vesicle docking and fusion. (A) TIRFM analysis for the fusion pattern of individual TD-Rab10 vesicles in rat fibroblasts transfected with the indicated plasmids. Individual fusion events are numbered and indicated by yellow arrows. Right bars are the changes of fluorescent intensity of TD-Rab10 vesicles (arrows in left image) over time. Note the persistence of Rab10 signals associated with the PM in D3 cells during the 100 s observation period. Docking and fusion are indicated with red arrowheads and green arrowheads, respectively. Scale bar, 10 μm. (B, C) Quantification of average numbers of fusion events with complete cycles of docking and fusion during 5 min observation time in each cell transfected with the indicated plasmids. Data are presented as mean ± SEM. At least eight cells in each group were analyzed. **P < 0.01, ***P < 0.001, n.s., not significant, Student's t-test. (D) Average number of TD-Rab10 vesicles per 25 μm2 in fixed cells. Epifluorescence (epi-F) and TIRF signals represent total and PM-associated Rab10, respectively. Data are presented as mean ± SEM. At least eight cells in each group were analyzed. **P < 0.01, ***P < 0.001, n.s., not significant, one-way ANOVA. (E) Quantification of average numbers of fusion events in the indicated groups. Data are presented as mean ± SEM. At least eight cells in each group were analyzed. **P < 0.01, ***P < 0.001, one-way ANOVA. (F, G) EM analysis for subcellular localization of MARCKS and Rab10 in the corpus callosum regions from P0 rat brain. Arrows indicate immunogold particles (12 nm) for Rab10 signals associated with PPV-like vesicles, and arrowheads indicate immunogold particles (18 nm) for MARCKS on the PM (F). Scale bar, 200 nm. The Rab10 and MARCKS localization is quantified (G). At least 30 slices for each group were analyzed. (H, I) Quantification of the durations from docking to fusion for Rab10 vesicles in the rat fibroblasts transfected with the indicated plasmids. At least 10 cells in each group were analyzed. ***P < 0.001, Student's t-test. (J) Immuno-EM analysis for subcellular localization of Rab10-positive vesicles in fibroblasts transfected with vehicle or D3 plasmids. Yellow arrows point to immunogolds for Rab10. Red arrowhead indicates an omega-shaped Rab10-positive structure. Note that Rab10-positive vesicles are accumulated in the cell periphery in D3-transfected cells. Scale bars, 200 nm. (K) Quantification of the number of accumulated vesicles at a distance of 200 nm from PM, on or underneath 2 μm length of PM. Data are presented as mean ± SEM. At least eight cells in each group were analyzed. ***P < 0.001, Student's t-test.

