Figure 7.
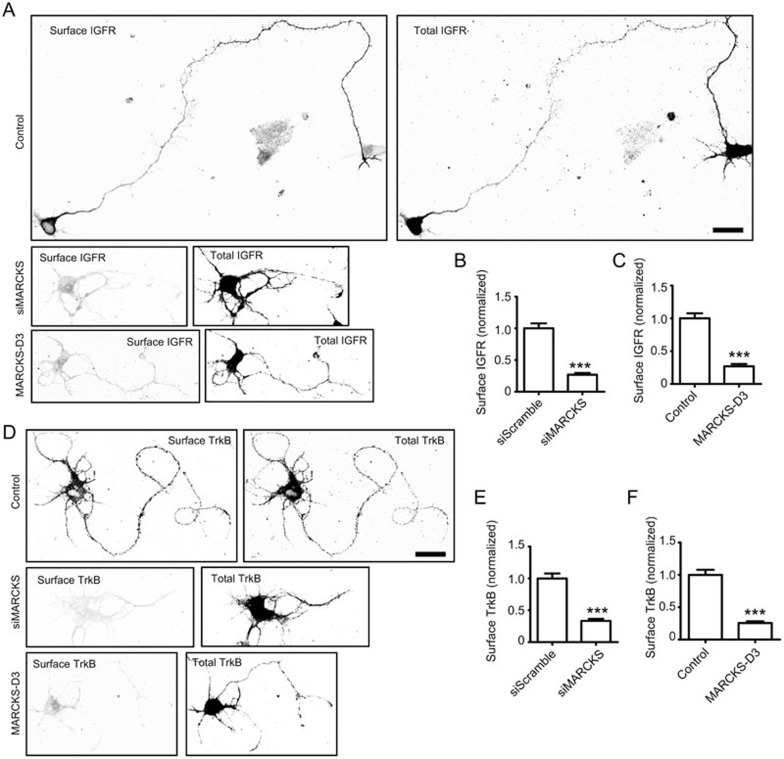
Role of MARCKS in surface expression of IGFR or TrkB. (A, D) Isolated cortical neurons were co-transfected with GFP-IGFR (A) or Flag-TrkB (D), together with siMARCKS or D3 or vehicle plasmid. At DIV3, cells were live stained with antibody against FLAG or GFP to reveal surface levels of TrkB or IGFR, respectively. After surface labeling, cells were penetrated and stained for total IGFR or TrkB. Scale bar, 20 μm. (B, C, E, F) Quantification of the surface levels of IGFR (B, C) or TrkB (E, F) in the indicated groups. Data are presented as mean ± SEM with value from control group normalized as 1.0. ***P < 0.01 (n = 10 for each group), Student's t-test.

