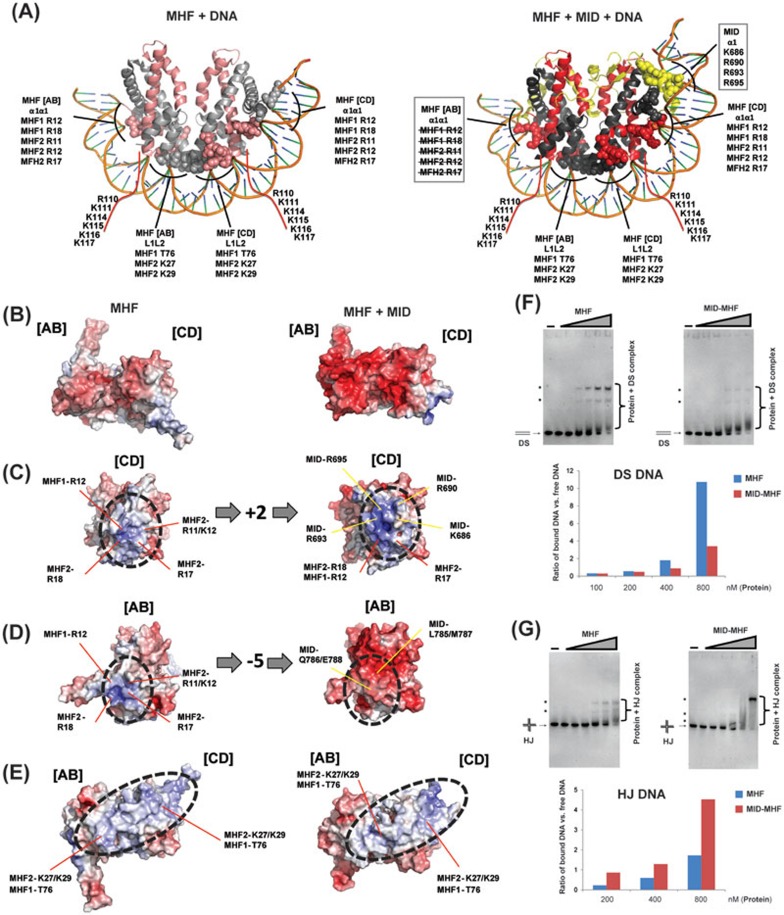
Figure 6.
MID alters the number of positive charges and allosteric structures in the MHF DNA-binding surfaces to favor branched DNA. (A) Structural models of the interaction between MHF tetramer (left) or MID-MHF pentamer (right) and double-stranded DNA as seen in the histone H3-H4 nucleosome structure (PDB ID: 3AFA). Potential MHF and MID DNA-interacting residues are labeled for the α1α1 and L1L2 protein-DNA contact sites. The residues highlighted in the two boxes are altered upon MID association: those crossed by lines are occluded by MID, whereas the other ones are contributed by MID (see B-D below). Red lines indicate the unstructured MHF1 C-terminal tail with residues predicted to contact DNA labeled. (B-E) Left panels show the MHF heterotetramer. Right panels show the MID-MHF pentamer. Electrostatic surface potentials are shown (red; electronegative; white, neutral; blue, electropositive; +/−10 kcal/electron unit, PyMOL APBS43). The binding of MID increased the number of positive charges in the highlighted surface area of MHF [CD] (C), decreased the positive charges in another area of MHF [AB] (D), and caused allosteric changes in the areas marked by red lines (E). (F) Top panel: EMSA for the comparison of the DNA-binding activity of MHF and MID-MHF complexes with double-stranded DNA (DS). The reaction contained the Digoxigenin-labeled DS DNA substrate (1 nM) with or without MHF and MID-MHF complexes as indicated. The protein concentrations are: 0, 25, 50, 100, 200, 400 and 800 nM, from left to right. Bottom: the specific protein-bound DNA bands (marked with dots) and free DS DNA substrate were quantified by KODAK Molecular Imaging Software, and their ratios are shown by a graph. (G) As described in F, excepted that HJ DNA was used.

