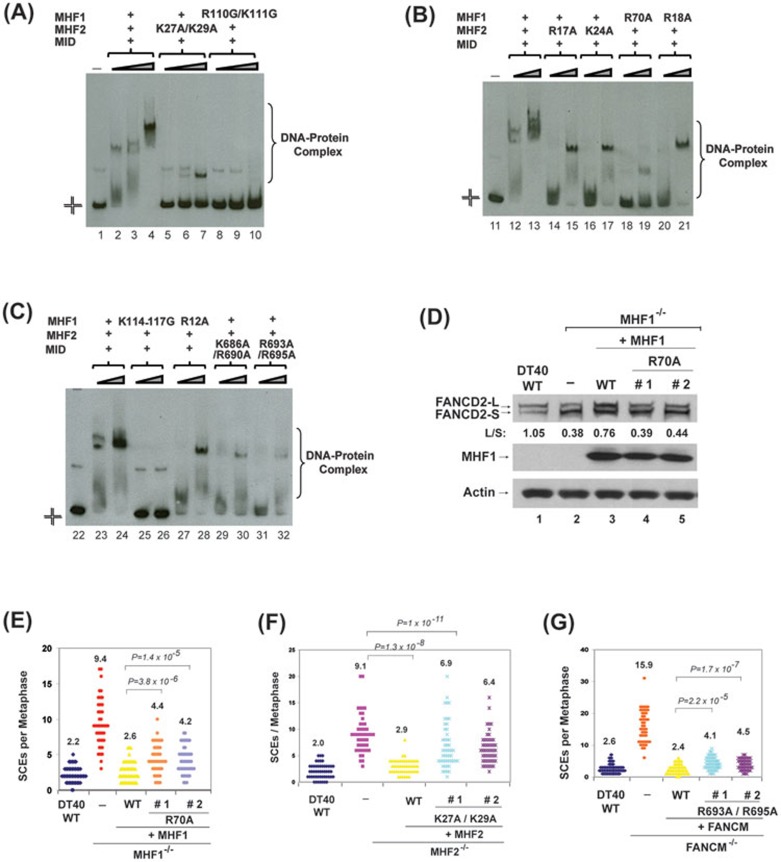
Figure 7.
The integrity of the DNA-binding interfaces of MID-MHF complex is required for normal activation of the FA network and suppression of SCEs. (A-C) Comparison of the DNA-binding activity of MID-MHF complexes containing either wild type or mutants by EMSA. The reaction contained the Digoxigenin-labeled Holliday junction DNA substrate (1 nM) with or without wild type and mutants of the MID-MHF complex as indicated. The protein concentrations are: MID-MHF complex wild type: 200 nM in lane 2; 400 nM in lanes 3, 12 and 23; 800 nM in lanes 4, 13 and 24; MID-MHF complex carrying MHF2 point mutant (K27A/K29A): 200, 400 and 800 nM in lanes 5-7, respectively; MID-MHF complex carrying MHF1 point mutant (R110G/K111G): 200, 400 and 800 nM in lanes 8-10, respectively; MID-MHF complex carrying MHF2 point mutant (R17A): 400 and 800 nM in lanes 14 and 15, respectively; MID-MHF complex carrying MHF2 point mutant (K24A): 400 and 800 nM in lanes 16 and 17, respectively; MID-MHF complex carrying MHF1 point mutant (R70A): 400 and 800 nM in lanes 18 and 19, respectively; MID-MHF complex carrying MHF1 point mutant (R18A): 400 and 800 nM in lanes 20 and 21, respectively; MID-MHF complex carrying MHF1 point mutant (K114-117G): 400 and 800 nM in lanes 25 and 26, respectively; MID-MHF complex carrying MHF1 point mutant (R12A): 400 and 800 nM in lanes 27 and 28, respectively; MID-MHF complex carrying MID point mutant (K686A/R690A): 400 and 800 nM in lanes 29 and 30, respectively; MID-MHF complex carrying MID point mutant (R693A/R695A): 400 and 800 nM in lanes 31 and 32, respectively. (D) Immunoblotting shows levels of FANCD2 and MHF1 in whole-cell lysates from the indicated DT40 cells: wild-type (WT), MHF1−/− cells, and MHF1−/− cells complemented with human WT or mutant of MHF1. The ratio between the monoubiquitinated and unubiquitinated FANCD2 (L/S) was shown. Cells were treated with MMC (50 ng/ml) for 18 h. Actin was used as a loading control. (E-G), Histograms showing spontaneous SCE levels of various DT40 cells as indicated. The mean number of SCEs per metaphase is listed. P-values were calculated using the Student's t-test.

