Figure 6.
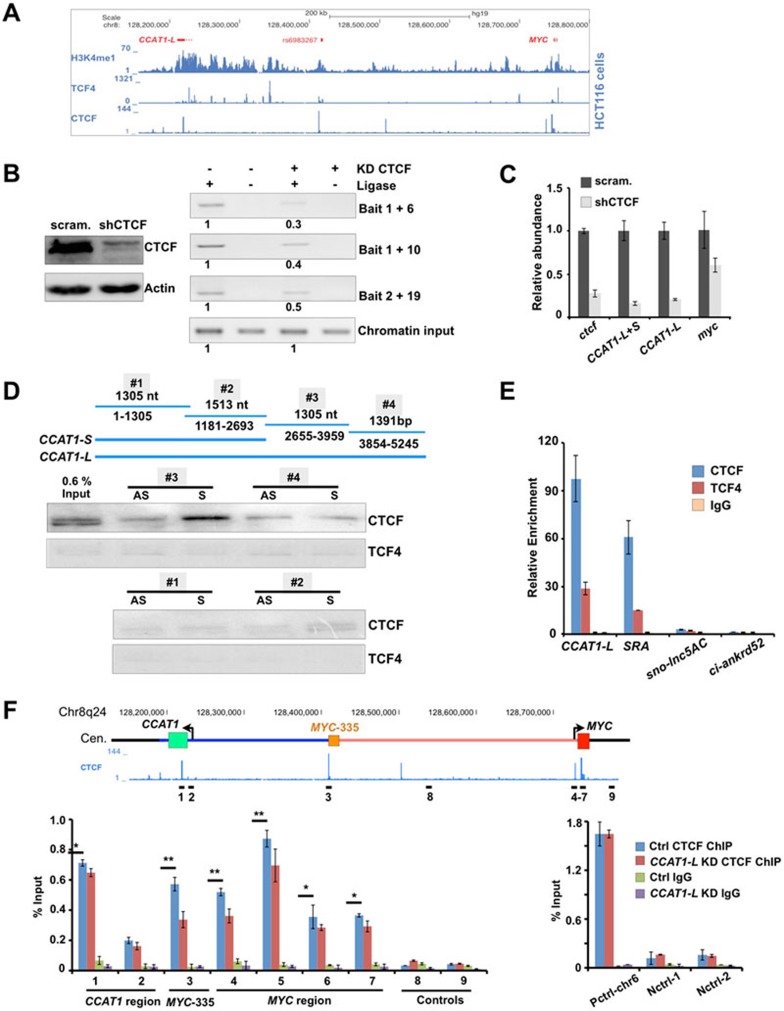
CCAT1-L interacts with CTCF and modulates CTCF binding to chromatin. (A) ChIP-seq revealed that TCF4 and CTCF are enriched at 8q24 in HCT116 cells (ChIP-seq data were retrieved from ENCODE collection39). (B) CTCF is required for chromatin looping at 8q24. Left, knockdown of CTCF was achieved using shRNA against CTCF as confirmed by WB. Right, the long-range interaction frequencies between three chromatin regions (MYC-335/MYC, MYC-335/MYC-515, and MYC/MYC-515, primers used in Figure 4) were reduced after knockdown of CTCF as revealed by 3C assays in HT29 cells. The relative abundance of each 3C PCR product was determined using ImageJ and labeled underneath. 3C experiments were repeated for three times. (C) CTCF is required for MYC and CCAT1-L expression. The relative abundance of MYC and CCAT1-L was analyzed by RT-qPCR in control and CTCF-knockdown HT29 cells. (D) CCAT1-L and CTCF interact in vitro. Top, a schematic view of four overlapping CCAT1-L RNA fragments for IVT. Bottom, biotin-labeled RNA pull-down assay using different fragments of CCAT1-L transcript in HT29 nuclear extracts showed that one fragment of CCAT1-L binding to CTCF. No CCAT1-L fragment was specifically associated with TCF4. (E) Interaction between endogenous CCAT1-L and CTCF was confirmed by RNA immunoprecipitation (RIP). RIP was performed with HT29 cells after UV crosslinking by using anti-CTCF, anti-TCF4 and anti-IgG, followed by RT-qPCR. Bar plots represent fold enrichments of RNAs immunoprecipitated by each indicated antibody over anti-IgG. SRA, steroid receptor RNA activator54; sno-lnc5AC, H/ACA sno-lncRNA32; ci-ankrd52, a circular intronic RNA33. (F) CCAT1-L modulates CTCF binding to chromatin. Knockdown of CCAT1-L reduced the interaction of CTCF to its occupied sites in chromatin. ChIP with anti-CTCF in scramble- and CCAT1-L ASO-treated HT29 cells. Data were expressed as the percentage of CTCF co-precipitating DNAs in MYC promoter, MYC-335, MYC-515 regions and negative CTCF binding sites on 8q24, versus input under each indicated condition (left). Control CTCF ChIPs were performed on positive and other negative CTCF binding sites (right). P values from one-tailed t-test in the pairwise comparison are shown (*P < 0.05, **P < 0.01). In E and F, error bars represent ± SD in triplicate experiments. Supportive data are included in Supplementary information, Figure S6.

