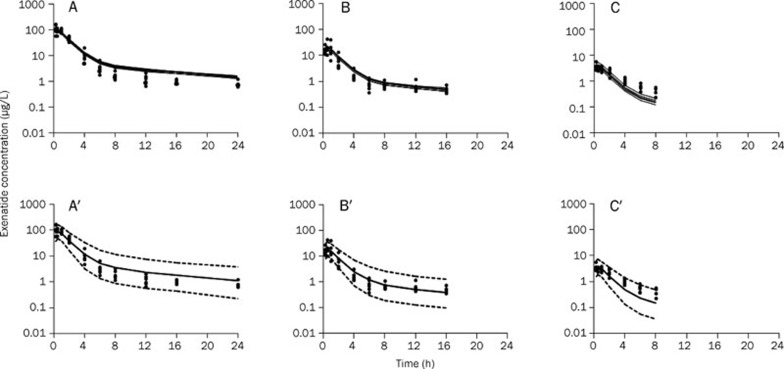
Figure 2.
Observed and predicted serum exenatide concentrations-time profiles after a single administration of exenatide at the dose of 210 (A), 42 (B), and 4.2 μg/kg (C) in diabetic rats. The solid dots represent individual data from rats and the solid lines represent the model fit lines. Visual predictive check of serum exenatide concentration-time profiles after single administrations of exenatide at the dose of 210 (A′), 42 (B′), and 4.2 μg/kg (C′). The ranges between the dotted lines depict the 90% prediction intervals. The solid lines present the medians of simulated data. The solid dots are the observed concentrations.

