
Figure 1.
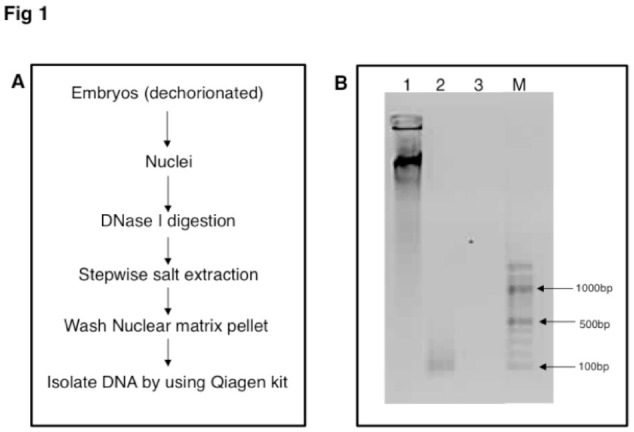
A: Flow chart of steps used for the isolation of MAR DNA from Drosophila melanogaster embryos. B: Ethidium bromide stained 1% agarose gel showing size distribution of MAR DNA from D. melanogaster embryos. Genomic DNA (lane 1); MAR DNA (lane 2); Isolated MAR DNA digested with DNase I (lane 3); 100 bp DNA marker (Lane M). High quality figures are available online.