
Figure 3.
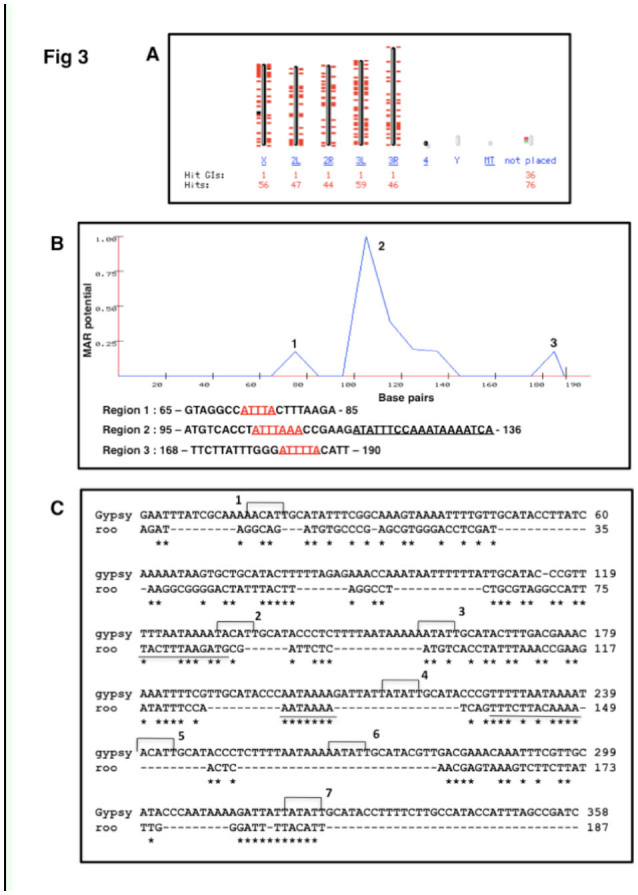
Analysis of roo MAR sequence. A: Genome view of distribution of roo MAR sequence in Drosophila melanogaster. B: Analysis of roo MAR with MAR-WIZ program. The regions with matrix association potential are shown as peaks in the graph. The matrix potential is shown on the Y-axis, and DNA in base pairs is shown on the X-axis. Sequences corresponding to the peaks are given below. Sequences relevant for MAR association are underlined. C: Sequence alignment of the roo MAR with the matrix-associated region of the gypsy transposable element using ClustalW program. On the gypsy sequence, topoisomerase II cleavage sites are marked with brackets and labelled 1–7. Sequences following ATC rule and an A-box are underlined. High quality figures are available online.