
FIGURE 3. Age patterns of fertility, by region, when TFR >4.5 and <5.5.
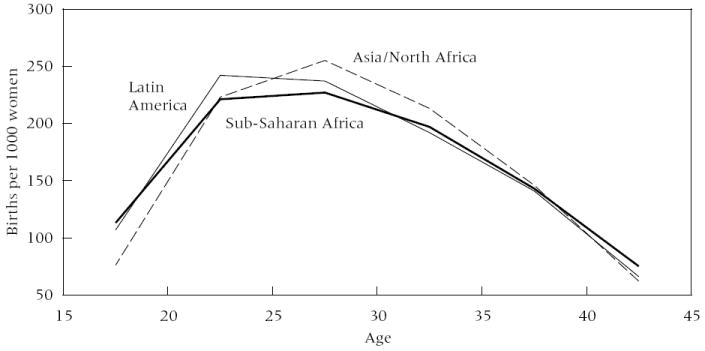
NOTE: Sample is one survey per country, TFR closest to 5.0. Age-specific rates adjusted to sum to TFR = 5.0. n = 38 countries.
Official websites use .gov
A
.gov website belongs to an official
government organization in the United States.
Secure .gov websites use HTTPS
A lock (
) or https:// means you've safely
connected to the .gov website. Share sensitive
information only on official, secure websites.
NOTE: Sample is one survey per country, TFR closest to 5.0. Age-specific rates adjusted to sum to TFR = 5.0. n = 38 countries.