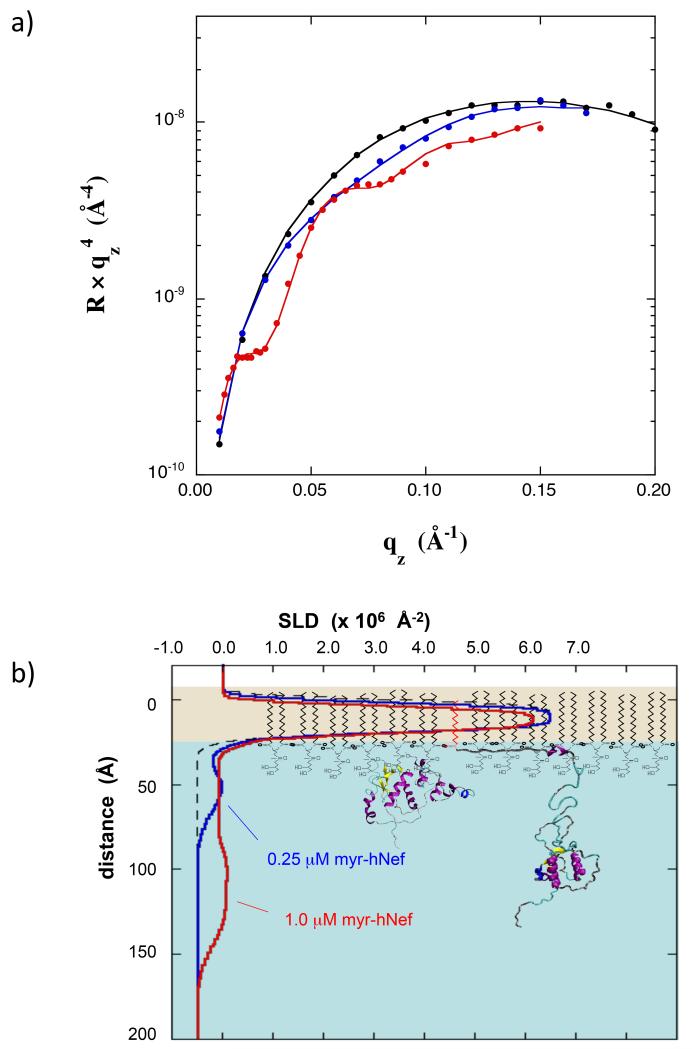
Figure 2.
(a) NR data for pure dDPPG monolayer at 30 mN/m on Tris-buffered H2O subphase (black) and with myr-hNef adsorbed from solutions at 0.25 μM (blue) and at 1.0 μM (red). Error bars at the highest qz values are the size of the data points. (b) SLD profiles corresponding to the data in (a). The molecular models of dDPPG and of Nef are not drawn precisely to scale but were scaled to coincide approximately with the corresponding features in the SLD profiles. See also Figure S1.

