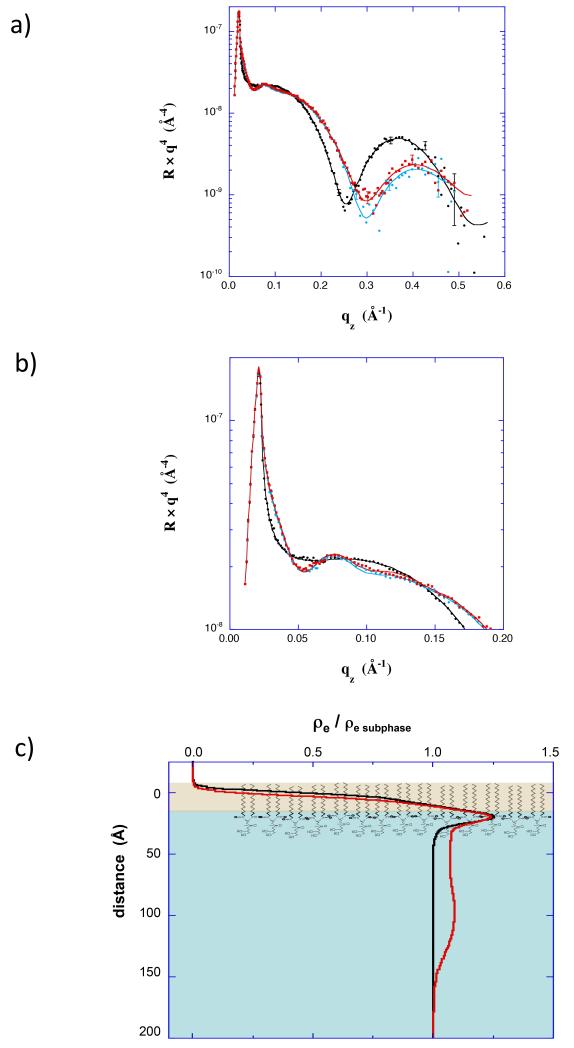
Figure 5.
(a) XR data for a 70/30 dDPPC/dDPPG monolayer at 20 mN/m (black) compared with a scan collected 22 hours after injecting 0.87 μM myr-Nef (cyan) and a scan collected after exchanging the subphase with buffer (red). (b) Expanded view of the XR data in a) showing the low qz region. (c) Electron density profiles corresponding to XR data in a).

