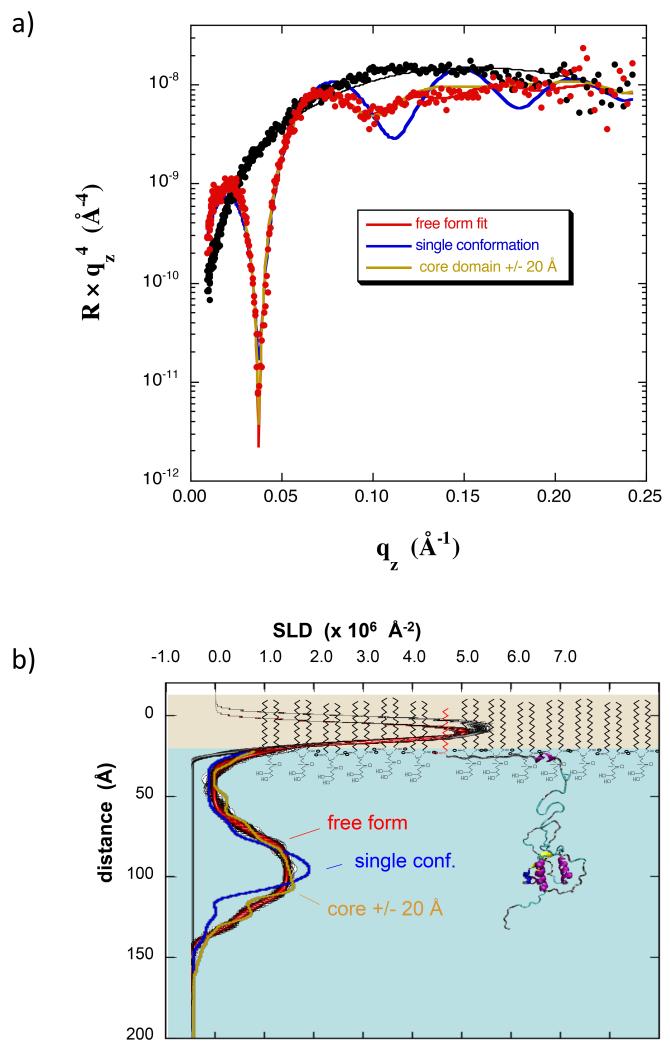
Figure 7.
(a) NR data for a dDPPG monolayer at 20 mN/m on Tris–buffered H2O subphase (black) and with bound myr-dNef adsorbed from solution at 0.28 μM (red). Best fits are shown using a free-form slab model (red), a model of Nef with residues 2-22 located in the membrane (blue), and an ensemble of three Nef structures in which the core domain distance from the membrane was adjusted +/− 20 Å relative to that of the structure shown in b) (yellow). (b) SLD profiles corresponding to the best-fits in (a). The red/black band corresponds to the best-fit profile with uncertainty limits using a free form slab model. The other curves have the same color coding as in a). The molecular model of Nef used in the SLD calculations is shown scaled such that the core domain coincides with the peak in the SLD profile. The lipids are not drawn precisely to scale. See also Figure S3.

