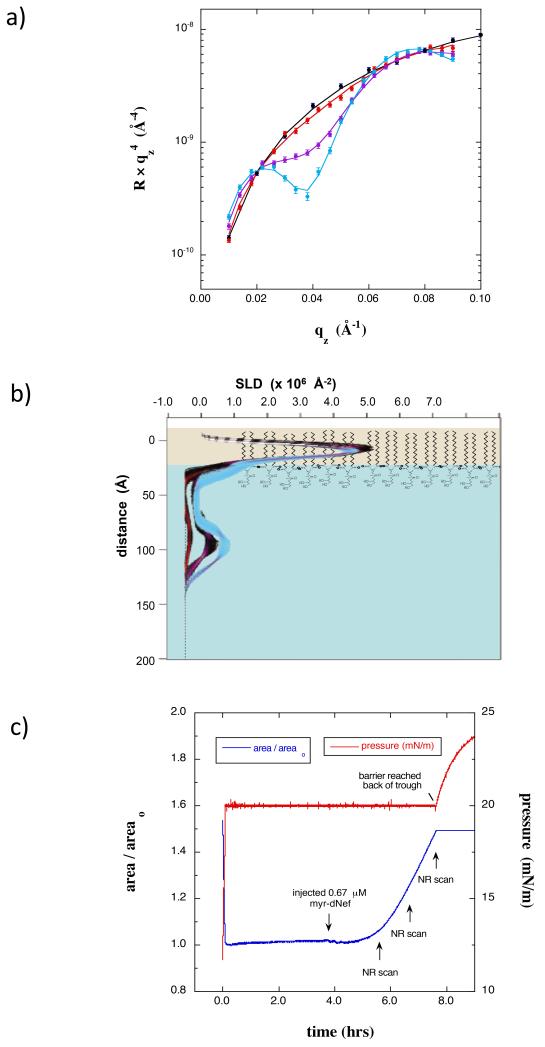
Figure 8.
(a) NR data for a dDPPG monolayer at 20 mN/m on on Tris-buffered H2O subphase (black) along with scans collected 2 h (red), 3 h (purple), and 4 h (cyan) after injecting 0.67 μM myr-dNef. The minimum at qz = 0.04 Å−1 is indicative of the thickness of the adsorbed protein layer. b) SLD profiles corresponding to the data in a). Red, purple, and cyan profile bands correspond to 2 hr, 3hr, and 4 hr after addition of myr-hNef, respectively.. The profiles indicate that at the earliest stages of adsorption membrane-bound Nef is predominantly in the open form. C) Normalized trough area versus time showing the expansion of the area upon injection of myr-dNef and the time at which the NR scans were initiated.

