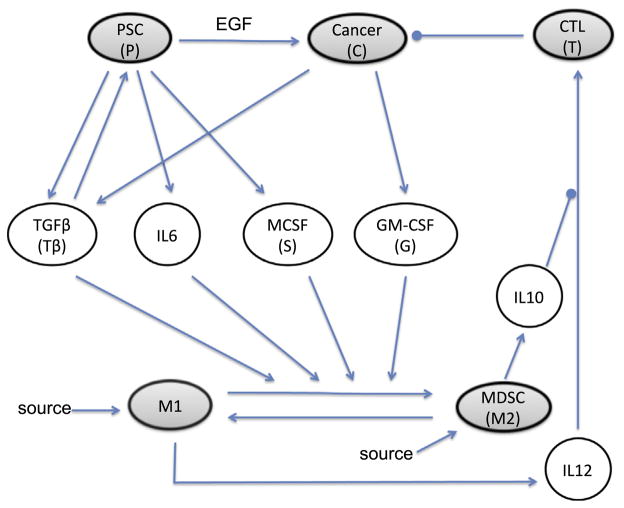
Fig. 1.
Interaction of cells and cytokines in pancreatic cancer. The model contains cells (shaded ellipses) and cytokines (clear ellipses) that operate in different time scales (days/years vs. minutes/hours). Arrows represent activation and circle-heads represent inhibition. Inhibition and activation can have different meanings for different elements. For cytokines, activation represents cytokine production. For tumor cells, inhibition represents the induction of apoptosis, and activation represents cell division. For CTLs activation/inhibition represent function increase/decrease of the killing rate. For macrophages, we assume a homing rate as well as the possibility of switch from one macrophage type to the other. The arrow associated with EGF means that PSCs increase proliferation of cancer cells by producing EGF. MDSC produces IL10 which inhibits activation of CTL by IL12.

