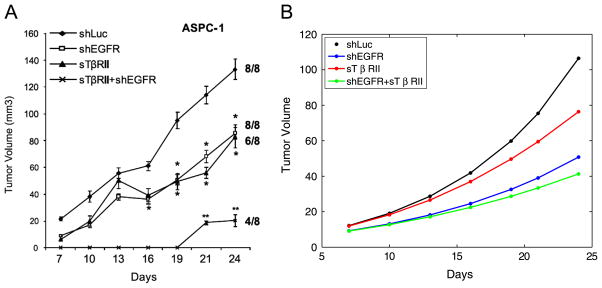
Fig. 3.

Comparison of different treatments. From top to bottom: no treatment; EGFR knockout; TGFβ silencing; both treatments. (A) Reproduced from Deharvengt et al. (2012). (B) Simulations of the model. For the four curves from top to bottom, the following fold parameters are used: r1 = 1, 0.6, 0.4, 0.3; r2 = 1, 0, 1, 0, where r1 and r2 are fold parameters for γp, γc, μp, and μc. (For interpretation of the references to color in this figure caption, the reader is referred to the web version of this article.)
