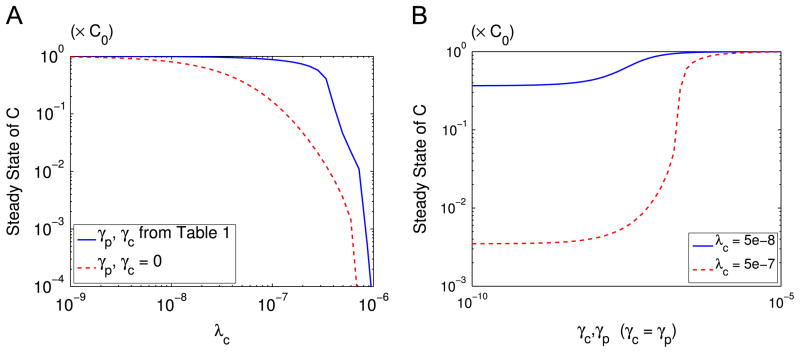
Fig. 5.
Effect of the immune system on the steady state tumor size. (A) Effect of T cell killing rate λc with (blue solid) and without (red dashed) tumor-induced effect on macrophage polarization represented by different γp, γc values. (B) Effect of cytokines on steady state tumor size for λc =5e−8 (blue solid) and λc = 5e−7 (red dashed). Here C is normalized by C0. (For interpretation of the references to color in this figure caption, the reader is referred to the web version of this article.)

