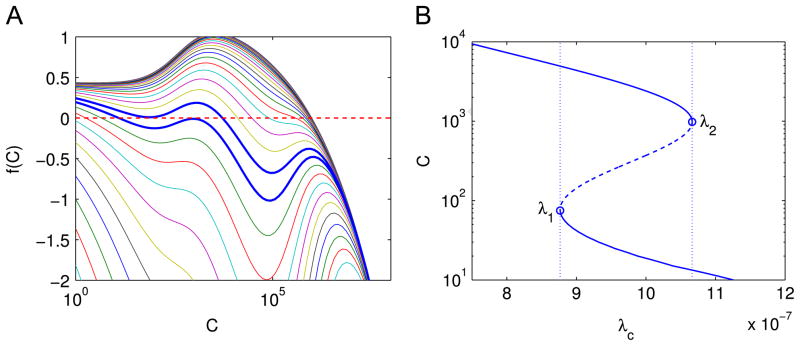
Fig. 6.
(A) The profile of f(C) as a function of C given different values of λc. Each line represents a different value of λc. The parameter λc increases from the top curve to the bottom curve, and the ratio of the λc’s of neighboring two curves is 1.25 fold. The steady state cancer size is where a curve decreases from positive to negative. The two thick blue curves have λc = 8.77e−7 and 1.07e−6 and correspond to λ1 and λ2 in (B). (B) Nonzero solutions of f (C) = 0 as a function of λc. Solid lines: stable steady states of the model; dashed line and open circles: unstable steady states. The dotted lines indicate the values of λ1 and λ2 where the saddle node bifurcations occur. (For interpretation of the references to color in this figure caption, the reader is referred to the web version of this article.)

