
EHEC/HUS outbreak origin reconstruction.
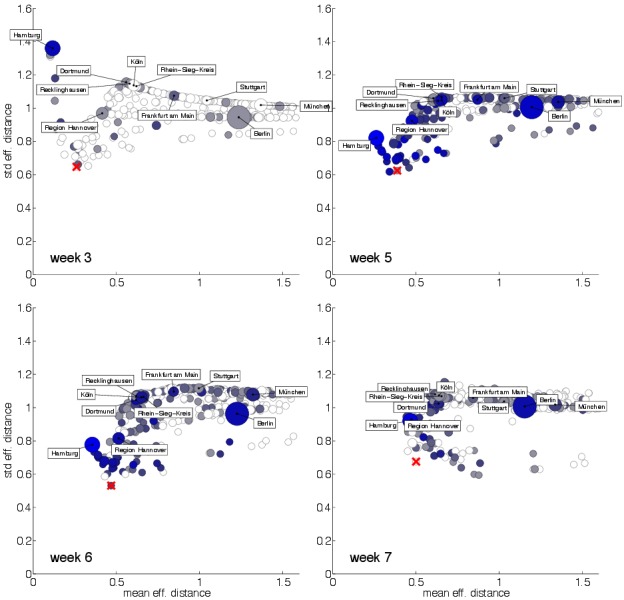
Each panel depicts a scatterplot of mean  and standard deviation
  (see Eqs. (14)) of effective distances
from candidate nodes
(see Eqs. (14)) of effective distances
from candidate nodes  to the subset
  of nodes that have nonzero incidence
for weeks
of nodes that have nonzero incidence
for weeks  after outbreak onset. All districts are
considered as potential candidates as outbreak origin. Symbol size
quantifies population size of each district, blueness quantifies
incidence in the respective week. A few large district are labeled. The
district with combined minimal mean and variance (closest to the origin)
has a high likelihood of being the actual 2011 EHEC/HUS outbreak origin.
The actual outbreak origin Uelzen in marked by a red cross.
after outbreak onset. All districts are
considered as potential candidates as outbreak origin. Symbol size
quantifies population size of each district, blueness quantifies
incidence in the respective week. A few large district are labeled. The
district with combined minimal mean and variance (closest to the origin)
has a high likelihood of being the actual 2011 EHEC/HUS outbreak origin.
The actual outbreak origin Uelzen in marked by a red cross.