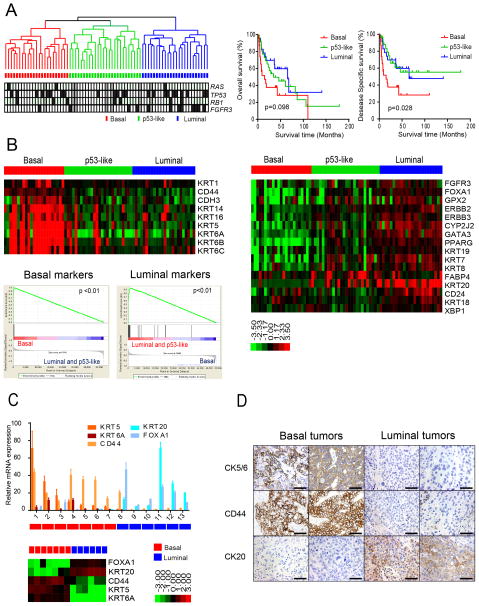
Figure 1. Basal and luminal subtypes of bladder cancer.
A. (Left) Whole genome mRNA expression profiling and hierarchical cluster analysis of a cohort of 73 MIBCs. RNA from fresh frozen tumors was analyzed using Illumina arrays. RAS, TP53, RB1, and FGFR3 mutations were detected by sequencing and are indicated in the color bars below the dendogram. Black, mutation; white, wild type; grey, mutation data were unavailable. (Right) Kaplan-Meier plots of overall survival (p = 0.098) and disease-specific survival (p = 0.028) in the 3 tumor subtypes. B. Expression of basal and luminal markers in the 3 subtypes. The heat maps depict relative expression of basal (left) and luminal (right) biomarkers. GSEA analyses (below, left) were used to determine whether basal and luminal markers were enriched in the subtypes. C. Quantitative RT-PCR was used to evaluate the accuracy of the gene expression profiling results. Relative levels of the indicated basal (red shades) and luminal (blue shades) biomarkers measured by RT-PCR were compared to the levels of the same markers measured by gene expression profiling on RNA isolated from macrodissected FFPE sections of the same tumors. Results are presented as relative quantitation (RQ) and the error bars indicate the range of RQ values as defined by 95% confidence level. RT-PCR results are shown on top, DASL gene expression profiling results are shown below. D. Analysis of basal and luminal marker expression by immunohistochemistry. Results from two representative basal (left) and luminal (right) tumors as defined by gene expression profiling are displayed. The scale bars correspond to 100 microns. See also Figure S1.

