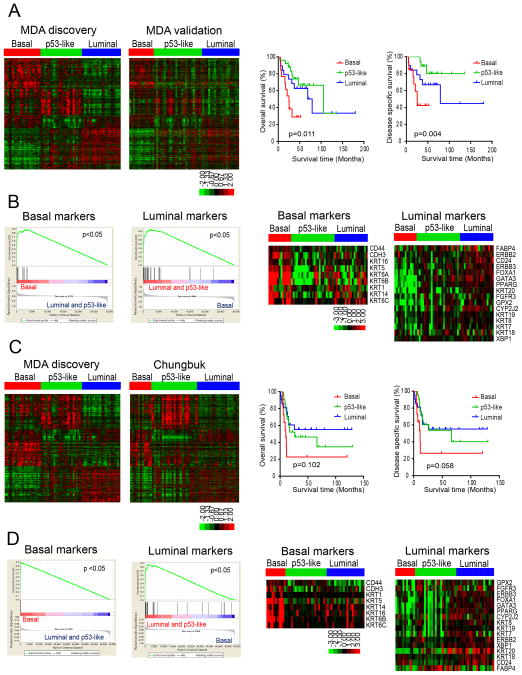
Figure 2. Characterization of basal and luminal subtypes in other MIBC cohorts.
A. Subtype classification of the MD Anderson validation cohort (n = 57). RNA was isolated from macrodissected FFPE tumor sections and whole genome mRNA expression was measured using Illumina’s DASL platform. Kaplan-Meier plots of overall survival (p = 0.011) and disease-specific survival (p=0.004) associated with the 3 subtypes are presented on the right. B. Expression of basal and luminal markers in the molecular subtypes in the MD Anderson validation cohort. The results of GSEA analyses of basal and luminal marker expression in the subtypes are displayed on the left, and heat maps depicting relative basal and luminal marker levels in the subtypes are displayed on the right. C. Subtype classification of the Chungbuk cohort (n = 55). Whole genome mRNA expression profiling (Illumina platform) and clinical data were downloaded from GEO (GSE13507), and the oneNN classifier was used to assign tumors to subtypes. Tumors were assigned to subtypes using the oneNN prediction model (left). Kaplan-Meier plots of overall survival (p = 0.102) and disease-specific survival (p = 0.058) as a function of tumor subtype (right). D. Expression of basal and luminal markers in the molecular subtypes in the Chungbuk cohort. The results of GSEA analyses of basal and luminal marker expression in the subtypes are displayed on the left, and heat maps depicting basal and luminal marker expression are displayed on the right. See also Tables S1 and S2.

