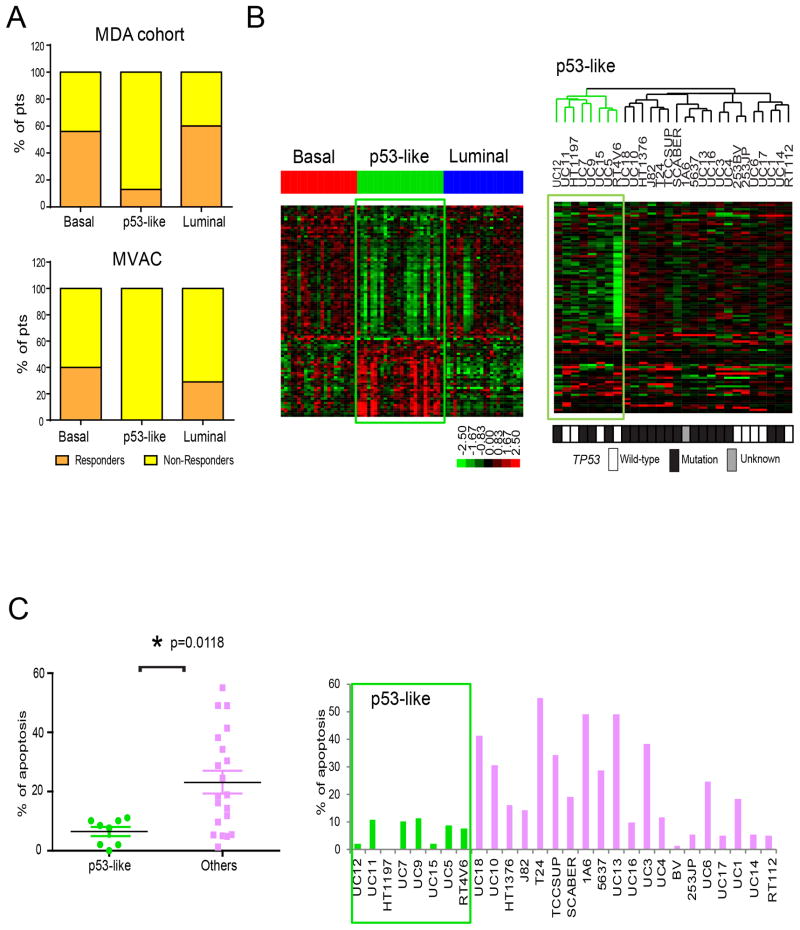
Figure 6. Relationship between subtype membership and chemotherapy sensitivity.
A. Responses to neoadjuvant chemotherapy in the MD Anderson NAC (n = 34) and MVAC (n = 23) cohorts. Subtype membership was determined using whole genome mRNA expression profiling data obtained from untreated (TURBT) tumors and the oneNN classifier. Pathological response was defined as downstaging to ≤ pT1. B. The IPA-defined p53 gene expression signature from the p53-like primary MIBCs was used to perform unsupervised hierarchical cluster analysis on whole genome expression data from a panel of human bladder cancer cell lines (n = 28). The green boxes on the heat maps indicate expression of the signature in the MD Anderson discovery cohort (left) or the cell lines (right). TP53 mutational status was determined by sequencing and is indicated by the color bar below the heat map (black = mutant, white = wild-type, grey = data were not available). C. Cells were incubated with or without 10 μM cisplatin for 48 h and apoptosis-associated DNA fragmentation was quantified by propidium iodide staining and FACS analysis in 3 independent experiments. The left panel displays a scatter gram comparing the levels within the two subsets of cell lines (mean ± SEM). The right panel displays the mean value of induced apoptosis in each cell line across the entire cohort. See also Tables S8 and S9.

