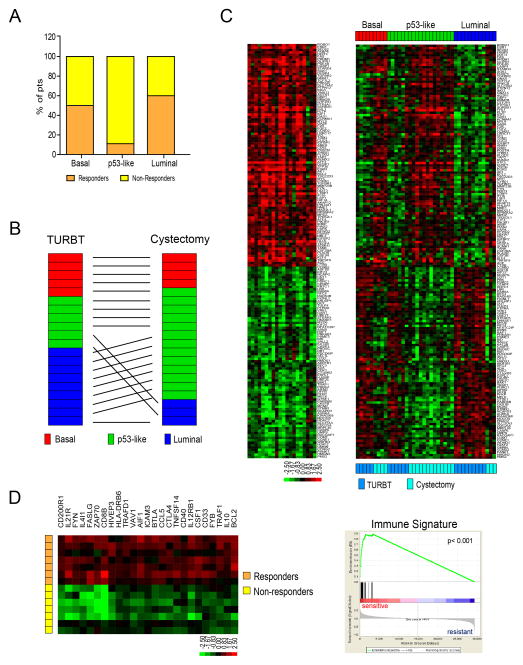
Figure 7. Wild-type p53 gene signatures in tumors before and after treatment with NAC.
A. Relationship between subtype membership and response to NAC in the Philadelphia DDMVAC cohort. Subtype membership was determined using pretreatment (TURBT) specimens. Pathological response was defined as downstaging to ≤ pT1. B. Comparison of subtype membership in the chemoresistant Philadelphia tumors before and after NAC. Whole genome mRNA expression profiling was performed on matched tumors before and after NAC, and the oneNN classifier was used to assign tumors to subtypes. “TURBT” refers to the pretreatment tumors and “cystectomy” to the post-treatment tumors. C. Expression of a wild-type p53 gene signature in matched pre- and post-treatment tumors. Left: heat map displaying expression of an active p53 gene signature after NAC (log ratio cystectomy/TURBT of matched tumors). Right: relative expression of the p53 signature in matched pre- and post-treatment tumors arranged according to subtype membership. D. Analysis of an immune infiltration signature in basal tumors. A supervised analysis was performed to compare the differences in gene expression between basal tumors that were either sensitive or resistant to neoadjuvant DDMVAC in the Philadelphia cohort. Left: heat map depicting the relative expression of immune signature genes in basal responders and non-responders. Right: GSEA analyses of immune biomarkers in the basal tumors. See also Tables S10 and S11 and Fig. S5.

