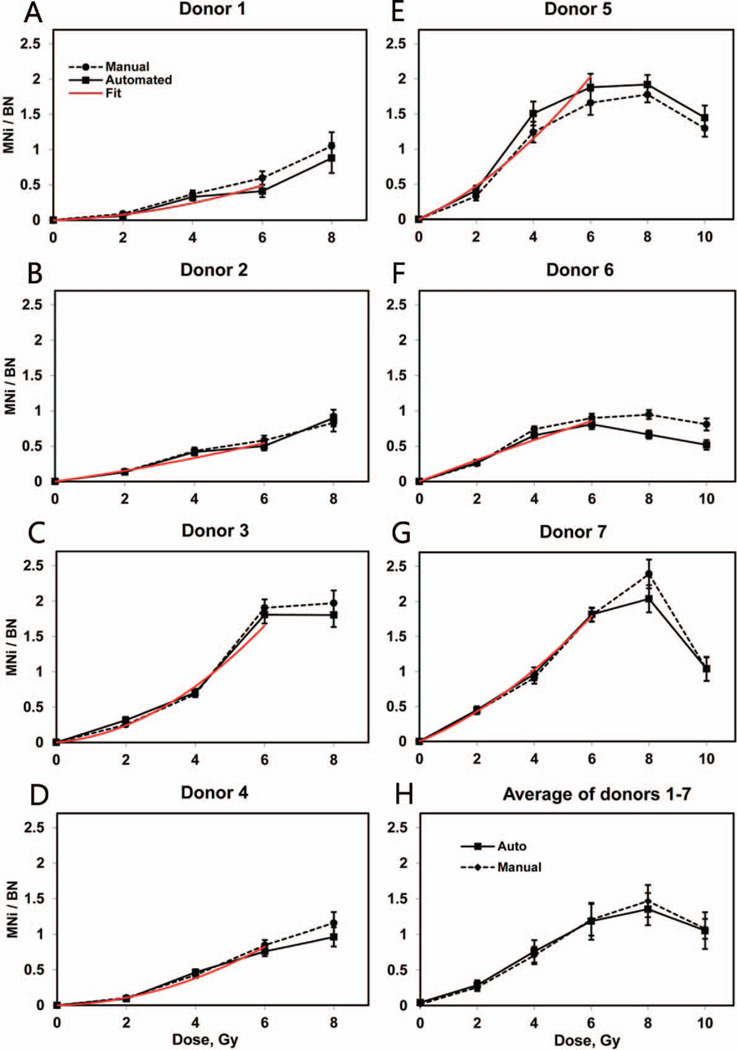
FIG. 5.
Individual (panels A–G) and averaged (panel H) induced frequencies of MNi (number of MNi per binucleated cell). Solid lines: automatically scored, dashed lines: manually scored. The error bars represent Poisson errors for the individual curves and standard error of the mean for the average dose response. The individual errors include uncertainties of the subtracted baseline values. The red lines are error-weighted linear-quadratic fits for the automatically obtained data from 0–6 Gy.

