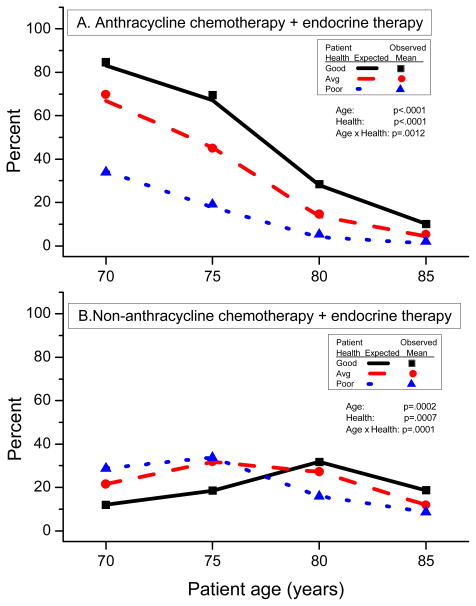
Figure 2.
Effects of patient age and health status on therapeutic recommendations for anthracycline chemotherapy or non-anthracycline chemotherapy. Lines are model estimates for Good Health (solid lines), Average Health (dashed lines), and Poor Health (dotted lines). Symbols are observed percents for Good Health (square), Average Health (circle), and Poor Health (triangle).

