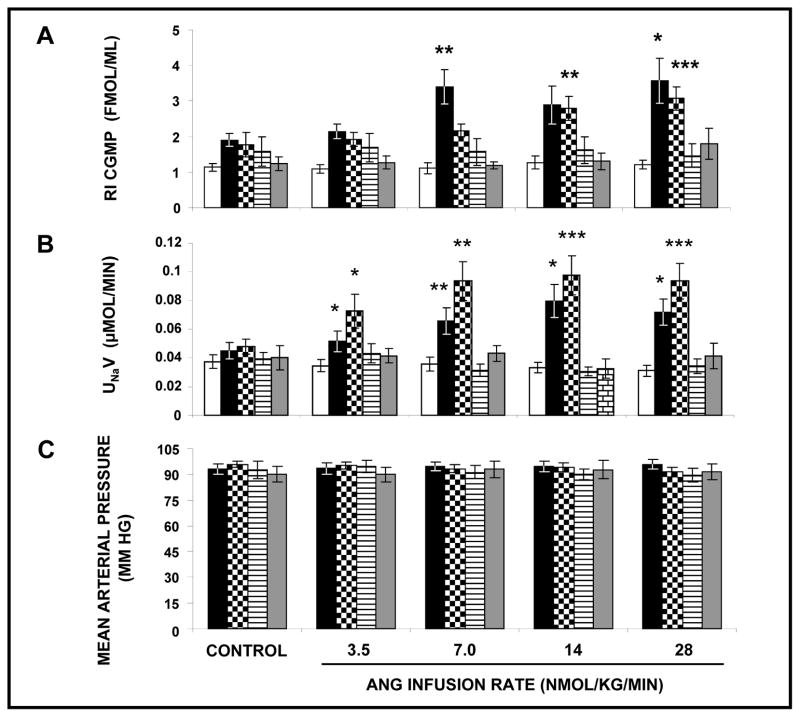
FIGURE 5.
Panel A. Renal interstitial (RI) cGMP levels in response to RI infusion of vehicle (□), (N=13), Ang III (■), (N=11), Ang III + APN inhibitor PC-18 (
 ), (N=8), Ang III + PC-18 + PD-123319 (▤), (N=11), and Ang III + PC-18 + soluble guanylyl cyclase inhibitor ODQ (
 ), (N=7). Results are reported as fmol/mL. Panel B. Urine Na+ excretion (UNaV) in response to conditions in Panel A. Results are reported as μmol/min. Panel C. Mean arterial pressure in response to conditions in Panel A. Results are reported as mm Hg. Data represent mean ± 1 SE. *P<0.05, **P<0.01, and ***P<0.001 from own control.

