
FIGURE 2.
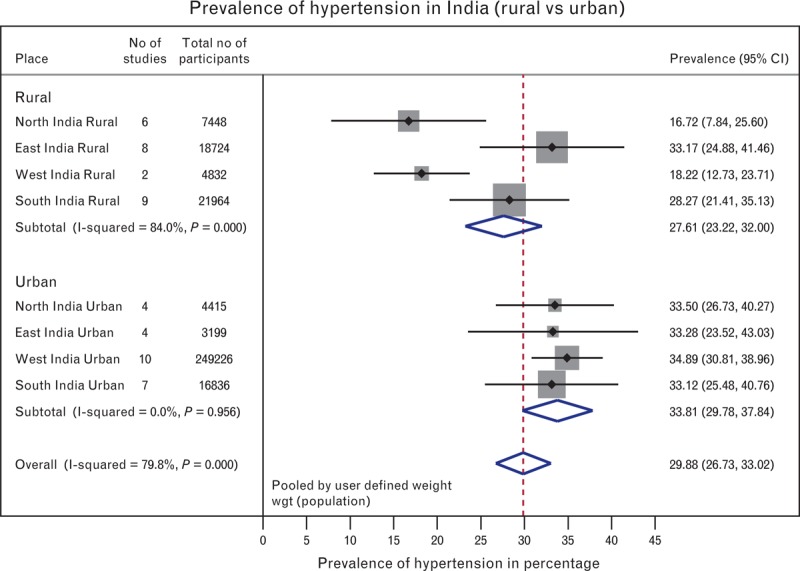
Overall pooled estimates: region-wise (north, east, west, and south) and place-wise (rural and urban). P value for overall rural and urban differences in hypertension (HTN) prevalence = 0.05∗; P value for rural and urban differences in HTN prevalence for east India = 0.98; P value for rural and urban differences in HTN prevalence for north India = 0.07; P value for rural and urban differences in HTN prevalence for south India = 0.62; P value for rural and urban differences in HTN prevalence for west India = 0.05∗. CI, confidence interval. ∗Statistically significant.