
FIGURE 3.
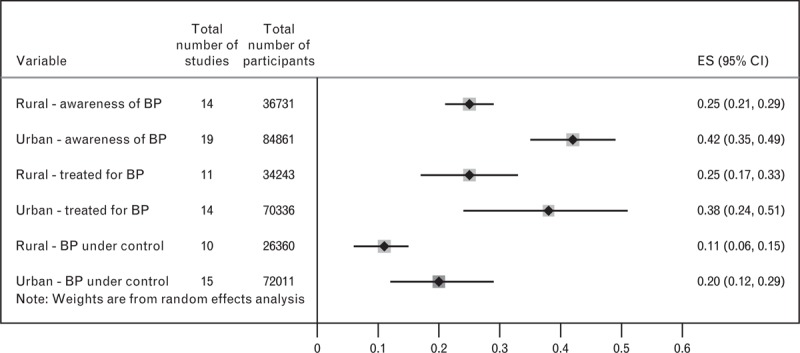
Percentage aware, treated, and under control for hypertension (HTN): urban and rural areas. P value for overall rural and urban differences in awareness of hypertension = 0.002∗; P value for rural and urban differences in HTN treatment = 0.112; P value for rural and urban differences in HTN control = 0.03∗. BP, blood pressure; CI, confidence interval; ES, pooled estimate; ∗Statistically significant.