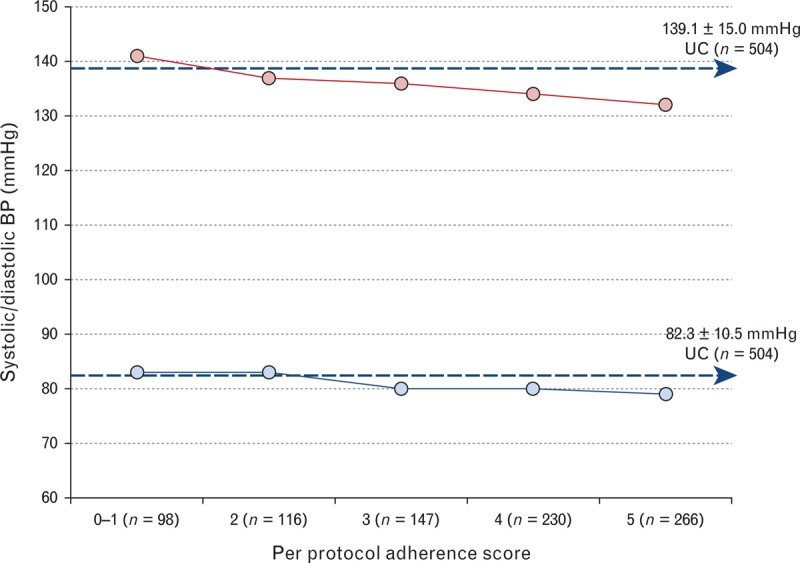
FIGURE 3.

Impact of increasing protocol adherence on mean SBP and DBP at 26 weeks (n = 857). Blue dashed arrows indicate the mean endpoint blood pressure (BP; systolic and diastolic) achieved by the usual care (UC) group as a comparator. Mean (95% confidence interval, CI) differences in SBP and DBP relative to a per protocol score of 0–1 are provided with significant differences (P < 0.05) observed for scores of 3 (P < 0.05) or more (4 or 5; P < 0.001). Standard error bars are contained within symbols.
