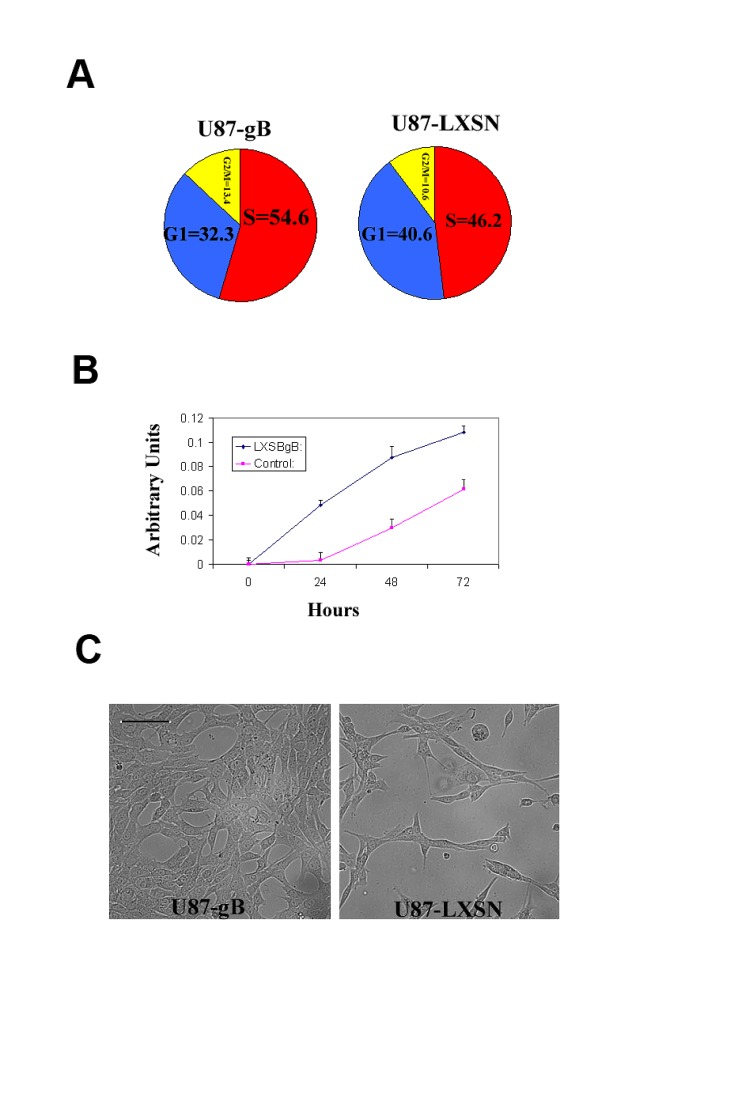
Figure 5. HCMV gB promotes glioma cell proliferation.
A. Pie chart representation of the cell cycle FACS analysis for U87-gB and U87-LXSN cells following 48h of serum starvation. 10,000 events were analyzed for each condition. The experiment was repeated three times. A representative result is shown; p=0.03, Student t-Test. B. MTT cell survival assay used to compare the baseline growth rates of U87-gB and U87-LXSN cells for 72h following 24h of serum starvation. Each condition was run in 6 wells of a 96 well plate. The experiment was repeated twice and a representative result is shown p = 0.01, student t- Test. C. Representative photomicrographs of U87-gB and U87-LXSN cells captured at 48 h following serum deprivation. Initial cell density was 5000 cells/well. Bar= 75μm.

