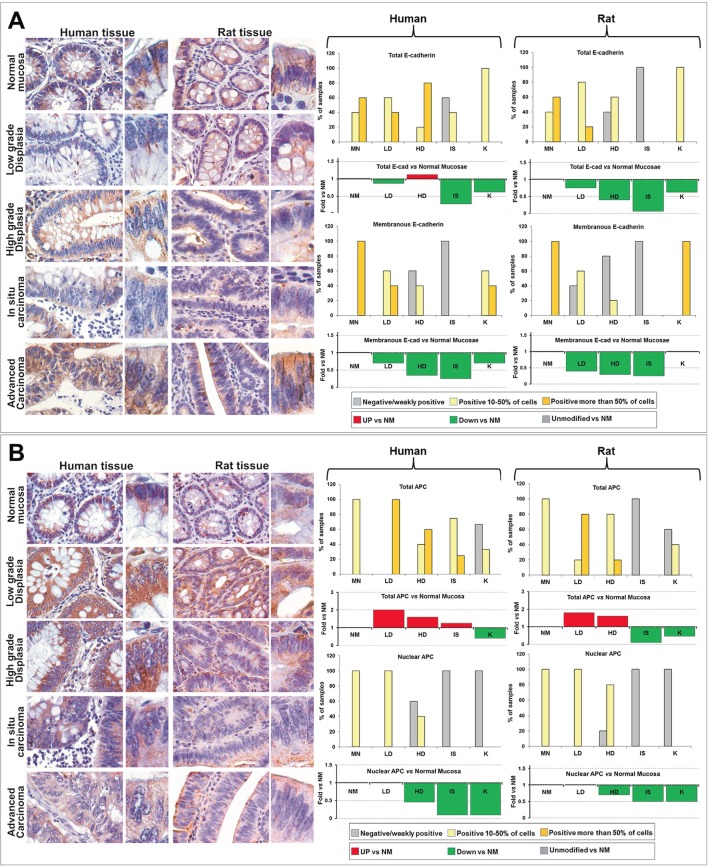
Figure 4. Comparative analysis of E-Cadherin (A) and APC (B) expression and subcellular localization during the colorectal carcinogenesis in humans and rats.
Left panels: Immunohistochemical analysis of colorectal rat tissues classified in the different histopathological groups (LD, HD, IS and K), compared with human tissues obtained from patients at the sequential stages of SCC from low grade dysplasia (LD) to invasive adenocarcinoma (K). OM: 20x, inset: 40x. Right panels: quantitative analyses of the expression and localization (total and nuclear), estimated as percentage of samples in which positive cells were less than 10% (negative or weakly positive), from 10 to 50%, and more than 50% of the cells constituting the epithelial mucosa (top bar graphs), and as trend vs normal mucosa (NM), reported as Fold vs NM (bottom bar graphs).

