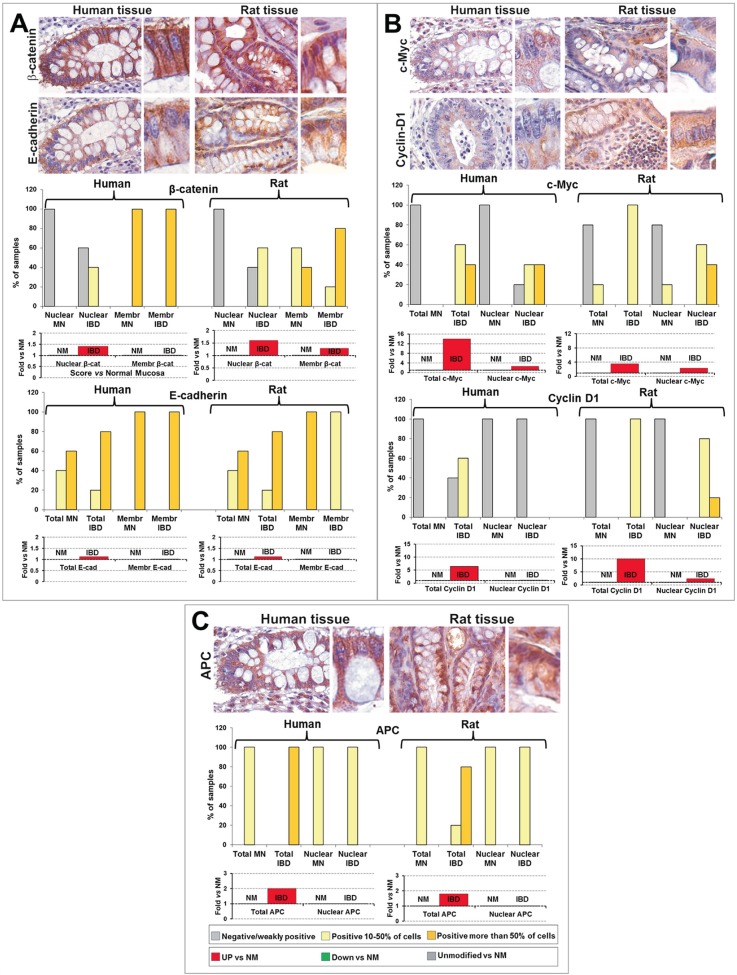
Figure 6. Comparative analysis of expression and subcellular localization of β-catenin and E-cadherin (A), c-Myc and Cyclin-D1 (B) and of APC (C) in IBD from humans and rats.
In each panel: representative images of the immunohistochemical analysis performed in human and rat IBD are shown; for each representative image, a detail at higher magnification of colonic epithelial cells is shown on the right inset; OM: 20x, inset: 40x. Bar graphs report the quantitative analyses of the expression and localization of each biomarker, estimated as percentage of samples in which positive cells were less than 10% (negative or weakly positive), from 10 to 50%, and more than 50% of the cells constituting the epithelial mucosa (top bar graphs), and as trend vs normal mucosa (NM), reported as Fold vs NM (bottom bar graphs).

