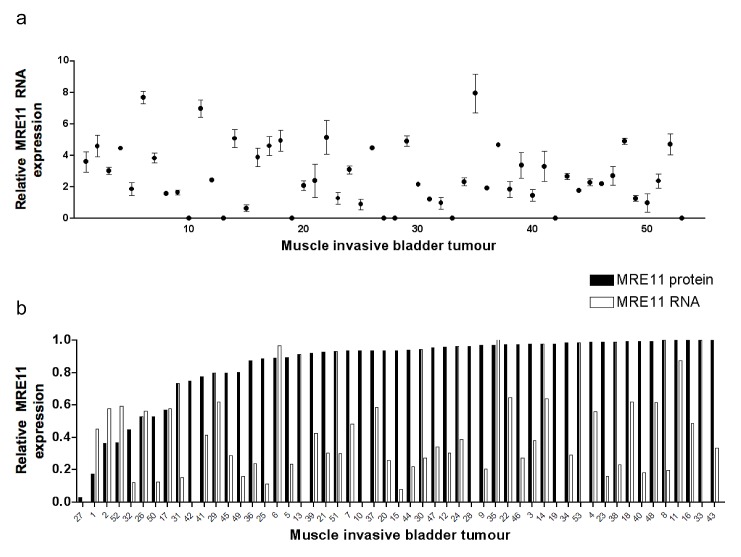
Figure 1. Bladder tumour MRE11 RNA and protein expression levels.
a) QPCR of RNA from FFPE bladder tumours (n=53), using SDHA and ATPB as endogenous controls. Data points represent values relative to the lowest value above zero. Error bars represent the standard error of the mean (SEM) from technical duplicates. b) Tumour MRE11 QPCR and IHC scores expressed relative to the highest value for each.

