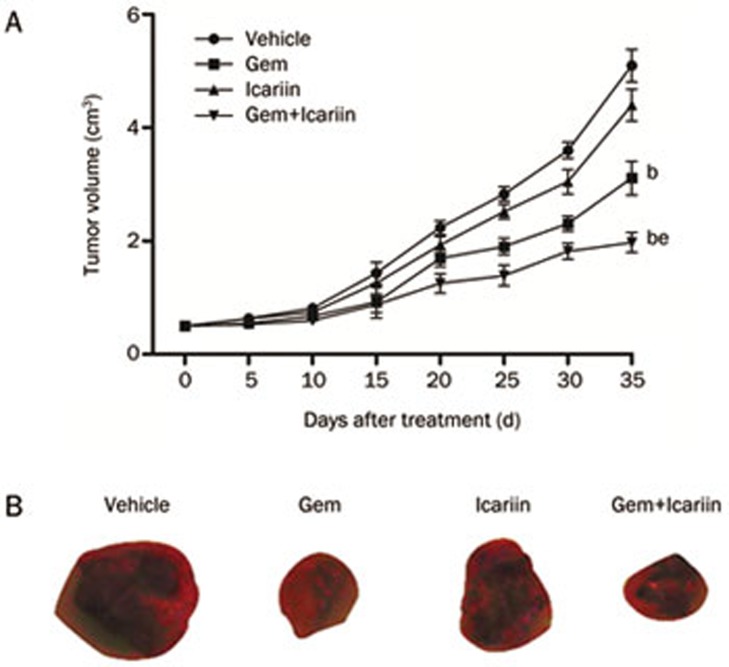
Figure 5.
Measurements of gallbladder tumor volume at the indicated time points, depicting the in vivo therapeutic efficacy of icariin and gemcitabine (A) with a representative picture of a tumor at the end of the experiment (B). n=15. bP<0.05 vs animals treated with vehicle. eP<0.05 vs animals treated with icariin or gemcitabine alone.

